Utah Food Stamps
How does Utah rank for percentage of homes receiving food stamps?
Utah ranks 5th out of 50 states for lowest percentage of households receiving food stamps at 1.2%. The study is based on a total of 938,365 Utahn households who reported whether or not food stamps were received.
How many Utah households received food stamps in the past year?
11,613 households in Utah received food stamps within the last year.
Utah Food Stamps Received Map
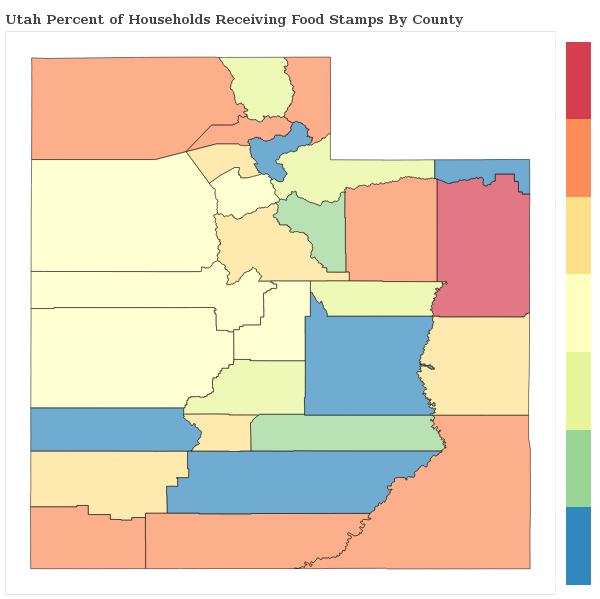
Utah Food Stamps Received Map
Food Stamps Received By County
The percentage of households receiving food stamps in Utah varies by county.
Applying For Utah Food Stamp Programs
How do I apply for food stamps in Utah?
There are 5 government food-related benefits that you may apply for as a resident of Utah.
Want to explore more government assistance programs? Browse all government benefits available to Utah residents.
Utah Percentage of Households Receiving Food Stamps by City Statistics
How does the percentage of homes receiving food stamps compare across the largest cities in Utah?
| City | Food Stamps | Details |
|---|---|---|
Layton |
1.4% |
Layton ranks 111th of 164 among cities in Utah based on a sample of 23,173 Utahn households in Layton. |
Ogden |
2.2% |
Ogden ranks 145th of 164 among cities in Utah based on a sample of 30,154 Utahn households in Ogden. |
Orem |
1.4% |
Orem ranks 115th of 164 among cities in Utah based on a sample of 27,518 Utahn households in Orem. |
Provo |
1.5% |
Provo ranks 124th of 164 among cities in Utah based on a sample of 32,904 Utahn households in Provo. |
Salt Lake City |
1.2% |
Salt Lake City ranks 94th of 164 among cities in Utah based on a sample of 76,876 Utahn households in Salt Lake City. |
Sandy |
1.3% |
Sandy ranks 108th of 164 among cities in Utah based on a sample of 30,382 Utahn households in Sandy. |
South Jordan |
1.3% |
South Jordan ranks 99th of 164 among cities in Utah based on a sample of 19,350 Utahn households in South Jordan. |
St. George |
1.1% |
St. George ranks 87th of 164 among cities in Utah based on a sample of 27,803 Utahn households in St. George. |
West Jordan |
1.3% |
West Jordan ranks 105th of 164 among cities in Utah based on a sample of 32,551 Utahn households in West Jordan. |
West Valley City |
1.4% |
West Valley City ranks 114th of 164 among cities in Utah based on a sample of 37,051 Utahn households in West Valley City. |
Research & Reports
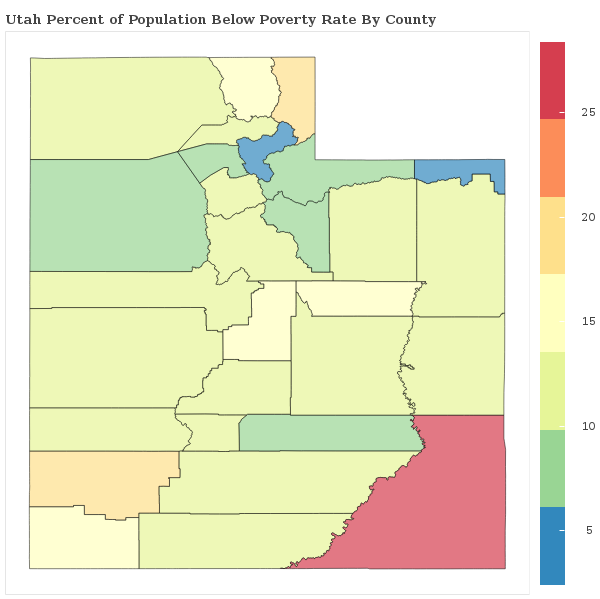
Utah Poverty Statistics
Which areas have the highest rate of poverty in Utah? We breakdown the poverty rate by city and county across Utah and rank communities with the highest and lowest concentrations of residents living below the poverty line.
Utah Poverty Statistics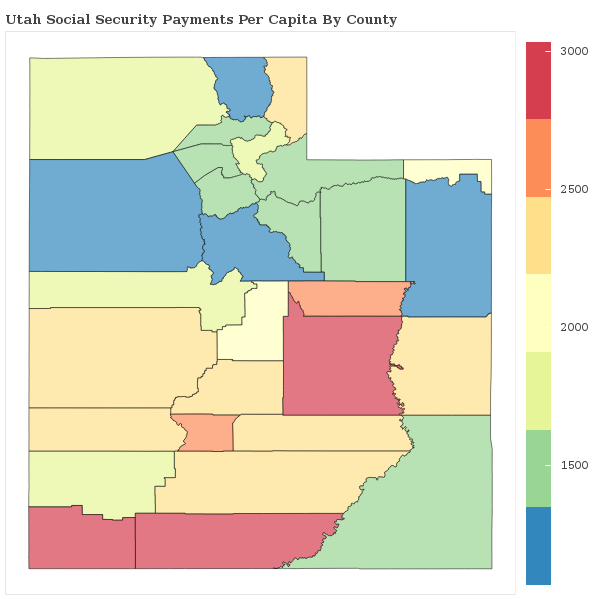
Social Security Payments in Utah
How are the Social Security Payments distributed throughout Utah? We breakdown social security benefits by city and county statewide and rank communities with the most and least social security income per capita.
Utah Social Security
Food Stamps in America
Which areas receive the most food stamp public assistance in your state? We breakdown over 3,000 counties nationwide and rank communities with the most and least food and nutrional supplements given to residents.
See Food Stamp Statistics2018 Utah Poverty Line
| Household Size | Poverty Level |
|---|---|
| 1 | $12,140 |
| 2 | $16,460 |
| 3 | $20,780 |
| 4 | $25,100 |
| 5 | $29,420 |
| 6 | $33,740 |
| Per Additional | +$4,320 |
The poverty line for Utah in 2018 is based on the federal guidelines, which begins at $12,140 for a single person, adding $4,320 for each additional person.
Poverty In America
