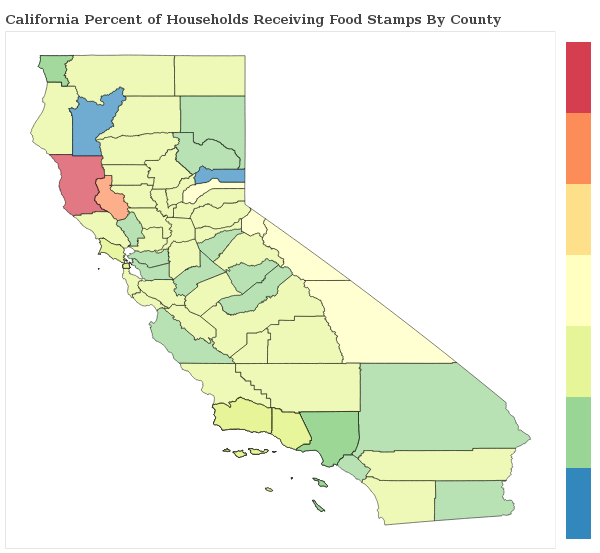
1.2% of Households Receive Food Stamps in Antioch, California
Food Stamps in Antioch, California
What percent of Households Receive Food Stamps in Antioch?
The percentage of households receiving food stamps in the last year in Antioch is 1.2%.
How Many Households in Antioch Receive Food Stamps?
There are 409 households out of 33803 in Antioch receiving food stamps.
Where does Antioch Rank in Comparison to Other California Cities for HouseHolds Receiving Food Stamps?
Antioch ranks 428th out of 1018 cities and towns in California for the least number of households receiving food stamps. A smaller numeric rank indicates a lower percentage of homes receive food stamps.
How do other cities in Contra Costa County compare to Antioch when it comes to the percentage of homes receiving Food Stamps?
Cities must have a minimum of 1,000 residents to qualify
| City | Food Stamps | Details |
|---|---|---|
Castle Hill |
0.0% |
0 of 466 Castle Hill households received food stamps within the past year. |
Clayton |
1.8% |
76 of 4,189 Clayton households received food stamps within the past year. |
Concord |
1.4% |
643 of 45,905 Concord households received food stamps within the past year. |
Crockett |
2.7% |
39 of 1,453 Crockett households received food stamps within the past year. |
Danville |
1.6% |
256 of 15,816 Danville households received food stamps within the past year. |
Discovery Bay |
1.8% |
97 of 5,308 Discovery Bay households received food stamps within the past year. |
East Richmond Heights |
0.8% |
11 of 1,438 East Richmond Heights households received food stamps within the past year. |
El Cerrito |
1.5% |
147 of 9,882 El Cerrito households received food stamps within the past year. |
Bay Point |
2.2% |
152 of 6,812 Bay Point households received food stamps within the past year. |
Bayview |
0.0% |
0 of 569 Bayview households received food stamps within the past year. |
Bethel Island |
0.0% |
0 of 1,034 Bethel Island households received food stamps within the past year. |
Blackhawk |
1.7% |
60 of 3,605 Blackhawk households received food stamps within the past year. |
Alamo |
1.9% |
100 of 5,341 Alamo households received food stamps within the past year. |
Antioch |
1.2% |
409 of 33,803 Antioch households received food stamps within the past year. |
Brentwood |
2.0% |
367 of 18,810 Brentwood households received food stamps within the past year. |
Byron |
1.1% |
5 of 453 Byron households received food stamps within the past year. |
Camino Tassajara |
2.4% |
24 of 990 Camino Tassajara households received food stamps within the past year. |
El Sobrante |
1.0% |
48 of 4,851 El Sobrante households received food stamps within the past year. |
Hercules |
1.8% |
148 of 8,193 Hercules households received food stamps within the past year. |
Kensington |
1.2% |
27 of 2,336 Kensington households received food stamps within the past year. |
Knightsen |
0.0% |
0 of 525 Knightsen households received food stamps within the past year. |
Lafayette |
1.1% |
105 of 9,530 Lafayette households received food stamps within the past year. |
Martinez |
0.8% |
118 of 14,773 Martinez households received food stamps within the past year. |
Montalvin Manor |
0.0% |
0 of 773 Montalvin Manor households received food stamps within the past year. |
Moraga |
1.0% |
57 of 5,682 Moraga households received food stamps within the past year. |
Mountain View |
2.9% |
26 of 906 Mountain View households received food stamps within the past year. |
North Richmond |
3.5% |
35 of 997 North Richmond households received food stamps within the past year. |
Oakley |
1.5% |
178 of 11,671 Oakley households received food stamps within the past year. |
Orinda |
0.6% |
41 of 6,943 Orinda households received food stamps within the past year. |
Pacheco |
0.0% |
0 of 1,661 Pacheco households received food stamps within the past year. |
Pinole |
0.7% |
46 of 6,745 Pinole households received food stamps within the past year. |
Pittsburg |
1.5% |
311 of 21,069 Pittsburg households received food stamps within the past year. |
Pleasant Hill |
0.9% |
119 of 13,696 Pleasant Hill households received food stamps within the past year. |
Reliez Valley |
0.0% |
0 of 1,483 Reliez Valley households received food stamps within the past year. |
Richmond |
1.3% |
495 of 36,716 Richmond households received food stamps within the past year. |
Rodeo |
1.2% |
40 of 3,293 Rodeo households received food stamps within the past year. |
Rollingwood |
0.7% |
6 of 840 Rollingwood households received food stamps within the past year. |
San Miguel |
0.0% |
0 of 1,112 San Miguel households received food stamps within the past year. |
San Pablo |
1.8% |
171 of 9,257 San Pablo households received food stamps within the past year. |
San Ramon |
1.5% |
363 of 24,811 San Ramon households received food stamps within the past year. |
Saranap |
0.7% |
16 of 2,441 Saranap households received food stamps within the past year. |
Shell Ridge |
4.1% |
17 of 418 Shell Ridge households received food stamps within the past year. |
Tara Hills |
2.8% |
49 of 1,723 Tara Hills households received food stamps within the past year. |
Vine Hill |
3.1% |
41 of 1,335 Vine Hill households received food stamps within the past year. |
Walnut Creek |
1.6% |
492 of 31,008 Walnut Creek households received food stamps within the past year. |
