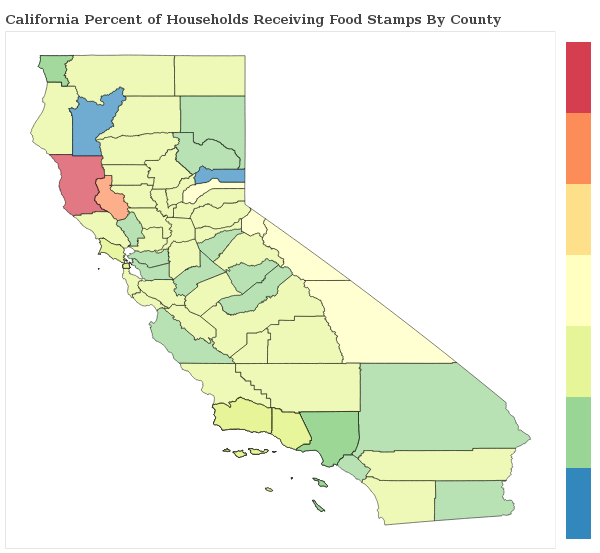
1.2% of Households Receive Food Stamps in Fremont, California
Food Stamps in Fremont, California
What percent of Households Receive Food Stamps in Fremont?
The percentage of households receiving food stamps in the last year in Fremont is 1.2%.
How Many Households in Fremont Receive Food Stamps?
There are 858 households out of 73617 in Fremont receiving food stamps.
Where does Fremont Rank in Comparison to Other California Cities for HouseHolds Receiving Food Stamps?
Fremont ranks 405th out of 1018 cities and towns in California for the least number of households receiving food stamps. A smaller numeric rank indicates a lower percentage of homes receive food stamps.
How do other cities in Alameda County compare to Fremont when it comes to the percentage of homes receiving Food Stamps?
Cities must have a minimum of 1,000 residents to qualify
| City | Food Stamps | Details |
|---|---|---|
Castro Valley |
1.3% |
310 of 23,046 Castro Valley households received food stamps within the past year. |
Cherryland |
1.7% |
82 of 4,855 Cherryland households received food stamps within the past year. |
Dublin |
1.1% |
200 of 19,023 Dublin households received food stamps within the past year. |
Ashland |
0.9% |
73 of 7,818 Ashland households received food stamps within the past year. |
Berkeley |
1.4% |
636 of 45,515 Berkeley households received food stamps within the past year. |
Alameda |
1.2% |
382 of 30,587 Alameda households received food stamps within the past year. |
Albany |
0.3% |
22 of 7,370 Albany households received food stamps within the past year. |
Emeryville |
1.3% |
85 of 6,540 Emeryville households received food stamps within the past year. |
Fairview |
2.4% |
88 of 3,630 Fairview households received food stamps within the past year. |
Fremont |
1.2% |
858 of 73,617 Fremont households received food stamps within the past year. |
Hayward |
1.2% |
564 of 47,044 Hayward households received food stamps within the past year. |
Livermore |
0.9% |
296 of 31,347 Livermore households received food stamps within the past year. |
Newark |
2.0% |
268 of 13,395 Newark households received food stamps within the past year. |
Oakland |
1.6% |
2531 of 159,448 Oakland households received food stamps within the past year. |
Piedmont |
0.8% |
31 of 3,919 Piedmont households received food stamps within the past year. |
Pleasanton |
1.2% |
324 of 27,922 Pleasanton households received food stamps within the past year. |
San Leandro |
1.3% |
421 of 32,290 San Leandro households received food stamps within the past year. |
San Lorenzo |
1.5% |
116 of 7,554 San Lorenzo households received food stamps within the past year. |
Union City |
1.2% |
256 of 21,106 Union City households received food stamps within the past year. |
