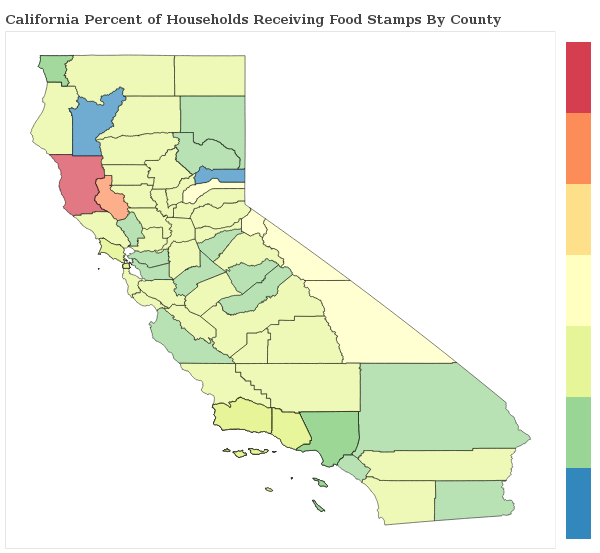
1.3% of Households Receive Food Stamps in Santa Rosa, California
Food Stamps in Santa Rosa, California
What percent of Households Receive Food Stamps in Santa Rosa?
The percentage of households receiving food stamps in the last year in Santa Rosa is 1.3%.
How Many Households in Santa Rosa Receive Food Stamps?
There are 849 households out of 64709 in Santa Rosa receiving food stamps.
Where does Santa Rosa Rank in Comparison to Other California Cities for HouseHolds Receiving Food Stamps?
Santa Rosa ranks 483rd out of 1018 cities and towns in California for the least number of households receiving food stamps. A smaller numeric rank indicates a lower percentage of homes receive food stamps.
How do other cities in Sonoma County compare to Santa Rosa when it comes to the percentage of homes receiving Food Stamps?
Cities must have a minimum of 1,000 residents to qualify
| City | Food Stamps | Details |
|---|---|---|
Cloverdale |
1.7% |
54 of 3,175 Cloverdale households received food stamps within the past year. |
Cotati |
1.9% |
53 of 2,850 Cotati households received food stamps within the past year. |
Eldridge |
0.0% |
0 of 489 Eldridge households received food stamps within the past year. |
Graton |
1.3% |
10 of 784 Graton households received food stamps within the past year. |
Boyes Hot Springs |
2.2% |
59 of 2,639 Boyes Hot Springs households received food stamps within the past year. |
El Verano |
0.9% |
12 of 1,343 El Verano households received food stamps within the past year. |
Fetters Hot Springs-Agua Caliente |
2.4% |
39 of 1,600 Fetters Hot Springs-Agua Caliente households received food stamps within the past year. |
Forestville |
1.0% |
16 of 1,600 Forestville households received food stamps within the past year. |
Guerneville |
1.7% |
40 of 2,298 Guerneville households received food stamps within the past year. |
Healdsburg |
1.5% |
69 of 4,729 Healdsburg households received food stamps within the past year. |
Kenwood |
0.0% |
0 of 556 Kenwood households received food stamps within the past year. |
Larkfield-Wikiup |
0.2% |
9 of 3,608 Larkfield-Wikiup households received food stamps within the past year. |
Monte Rio |
0.0% |
0 of 525 Monte Rio households received food stamps within the past year. |
Penngrove |
1.8% |
21 of 1,154 Penngrove households received food stamps within the past year. |
Petaluma |
2.0% |
444 of 22,202 Petaluma households received food stamps within the past year. |
Rohnert Park |
0.8% |
126 of 15,976 Rohnert Park households received food stamps within the past year. |
Roseland |
2.3% |
39 of 1,729 Roseland households received food stamps within the past year. |
Santa Rosa |
1.3% |
849 of 64,709 Santa Rosa households received food stamps within the past year. |
Sea Ranch |
0.0% |
0 of 618 Sea Ranch households received food stamps within the past year. |
Sebastopol |
0.4% |
13 of 3,408 Sebastopol households received food stamps within the past year. |
Sonoma |
0.9% |
42 of 4,910 Sonoma households received food stamps within the past year. |
Temelec |
0.0% |
0 of 1,070 Temelec households received food stamps within the past year. |
Windsor |
3.0% |
275 of 9,161 Windsor households received food stamps within the past year. |
