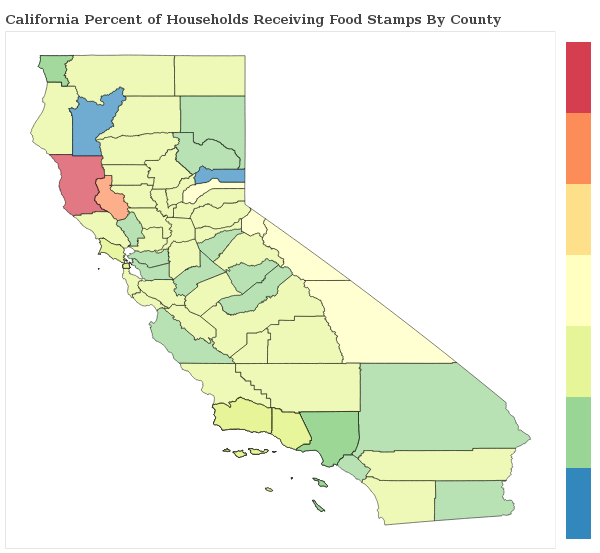
1.4% of Households Receive Food Stamps in Visalia, California
Food Stamps in Visalia, California
What percent of Households Receive Food Stamps in Visalia?
The percentage of households receiving food stamps in the last year in Visalia is 1.4%.
How Many Households in Visalia Receive Food Stamps?
There are 601 households out of 42241 in Visalia receiving food stamps.
Where does Visalia Rank in Comparison to Other California Cities for HouseHolds Receiving Food Stamps?
Visalia ranks 556th out of 1018 cities and towns in California for the least number of households receiving food stamps. A smaller numeric rank indicates a lower percentage of homes receive food stamps.
How do other cities in Tulare County compare to Visalia when it comes to the percentage of homes receiving Food Stamps?
Cities must have a minimum of 1,000 residents to qualify
| City | Food Stamps | Details |
|---|---|---|
Cutler |
4.2% |
52 of 1,252 Cutler households received food stamps within the past year. |
Dinuba |
1.5% |
95 of 6,147 Dinuba households received food stamps within the past year. |
Earlimart |
1.5% |
30 of 2,038 Earlimart households received food stamps within the past year. |
East Porterville |
4.3% |
65 of 1,518 East Porterville households received food stamps within the past year. |
Goshen |
0.0% |
0 of 998 Goshen households received food stamps within the past year. |
Alpaugh |
2.3% |
6 of 258 Alpaugh households received food stamps within the past year. |
Exeter |
2.1% |
72 of 3,359 Exeter households received food stamps within the past year. |
Farmersville |
1.3% |
34 of 2,652 Farmersville households received food stamps within the past year. |
Ivanhoe |
3.5% |
39 of 1,100 Ivanhoe households received food stamps within the past year. |
Lindsay |
1.1% |
40 of 3,567 Lindsay households received food stamps within the past year. |
London |
0.6% |
3 of 464 London households received food stamps within the past year. |
Matheny |
1.2% |
4 of 327 Matheny households received food stamps within the past year. |
Orosi |
1.7% |
34 of 2,000 Orosi households received food stamps within the past year. |
Patterson Tract |
2.2% |
13 of 595 Patterson Tract households received food stamps within the past year. |
Pixley |
0.0% |
0 of 869 Pixley households received food stamps within the past year. |
Plainview |
0.0% |
0 of 269 Plainview households received food stamps within the past year. |
Poplar-Cotton Center |
2.4% |
16 of 676 Poplar-Cotton Center households received food stamps within the past year. |
Porterville |
1.6% |
265 of 16,766 Porterville households received food stamps within the past year. |
Richgrove |
2.0% |
14 of 688 Richgrove households received food stamps within the past year. |
Strathmore |
1.5% |
14 of 933 Strathmore households received food stamps within the past year. |
Sultana |
4.0% |
11 of 275 Sultana households received food stamps within the past year. |
Terra Bella |
2.3% |
16 of 711 Terra Bella households received food stamps within the past year. |
Teviston |
0.0% |
0 of 285 Teviston households received food stamps within the past year. |
Three Rivers |
0.4% |
4 of 1,035 Three Rivers households received food stamps within the past year. |
Tipton |
0.8% |
6 of 755 Tipton households received food stamps within the past year. |
Tulare |
1.4% |
254 of 18,522 Tulare households received food stamps within the past year. |
Visalia |
1.4% |
601 of 42,241 Visalia households received food stamps within the past year. |
Woodlake |
1.5% |
31 of 2,135 Woodlake households received food stamps within the past year. |
Woodville |
0.4% |
2 of 453 Woodville households received food stamps within the past year. |
