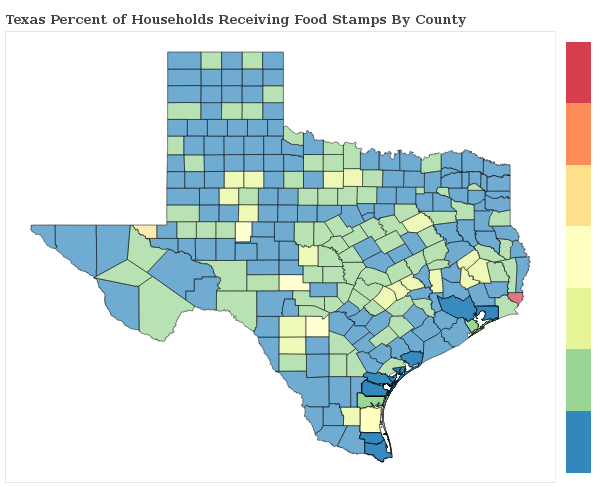
1.0% of Households Receive Food Stamps in Brownsville, Texas
Food Stamps in Brownsville, Texas
What percent of Households Receive Food Stamps in Brownsville?
The percentage of households receiving food stamps in the last year in Brownsville is 1.0%.
How Many Households in Brownsville Receive Food Stamps?
There are 535 households out of 51108 in Brownsville receiving food stamps.
Where does Brownsville Rank in Comparison to Other Texas Cities for HouseHolds Receiving Food Stamps?
Brownsville ranks 473rd out of 983 cities and towns in Texas for the least number of households receiving food stamps. A smaller numeric rank indicates a lower percentage of homes receive food stamps.
How do other cities in Cameron County compare to Brownsville when it comes to the percentage of homes receiving Food Stamps?
Cities must have a minimum of 1,000 residents to qualify
| City | Food Stamps | Details |
|---|---|---|
Brownsville |
1.0% |
535 of 51,108 Brownsville households received food stamps within the past year. |
Cameron Park |
0.8% |
12 of 1,440 Cameron Park households received food stamps within the past year. |
Combes |
1.7% |
15 of 859 Combes households received food stamps within the past year. |
Encantada-Ranchito-El Calaboz |
0.0% |
0 of 451 Encantada-Ranchito-El Calaboz households received food stamps within the past year. |
Harlingen |
1.1% |
237 of 20,654 Harlingen households received food stamps within the past year. |
La Feria |
1.1% |
26 of 2,263 La Feria households received food stamps within the past year. |
Laguna Heights |
1.0% |
9 of 894 Laguna Heights households received food stamps within the past year. |
Laguna Vista |
1.3% |
18 of 1,360 Laguna Vista households received food stamps within the past year. |
La Paloma |
2.9% |
25 of 876 La Paloma households received food stamps within the past year. |
Las Palmas II |
0.0% |
0 of 352 Las Palmas II households received food stamps within the past year. |
Laureles |
0.0% |
0 of 908 Laureles households received food stamps within the past year. |
Los Fresnos |
0.3% |
5 of 1,983 Los Fresnos households received food stamps within the past year. |
Olmito |
0.0% |
0 of 378 Olmito households received food stamps within the past year. |
Palm Valley |
1.8% |
13 of 737 Palm Valley households received food stamps within the past year. |
Port Isabel |
0.9% |
17 of 1,894 Port Isabel households received food stamps within the past year. |
Primera |
1.9% |
26 of 1,336 Primera households received food stamps within the past year. |
Rancho Viejo |
0.0% |
0 of 907 Rancho Viejo households received food stamps within the past year. |
Reid Hope King |
0.0% |
0 of 248 Reid Hope King households received food stamps within the past year. |
Rio Hondo |
0.5% |
5 of 938 Rio Hondo households received food stamps within the past year. |
San Benito |
0.8% |
58 of 7,626 San Benito households received food stamps within the past year. |
Santa Rosa |
0.0% |
0 of 750 Santa Rosa households received food stamps within the past year. |
South Padre Island |
0.0% |
0 of 1,586 South Padre Island households received food stamps within the past year. |
South Point |
0.0% |
0 of 293 South Point households received food stamps within the past year. |
