1.4% of Households Receive Food Stamps in The Woodlands, Texas
Food Stamps in The Woodlands, Texas
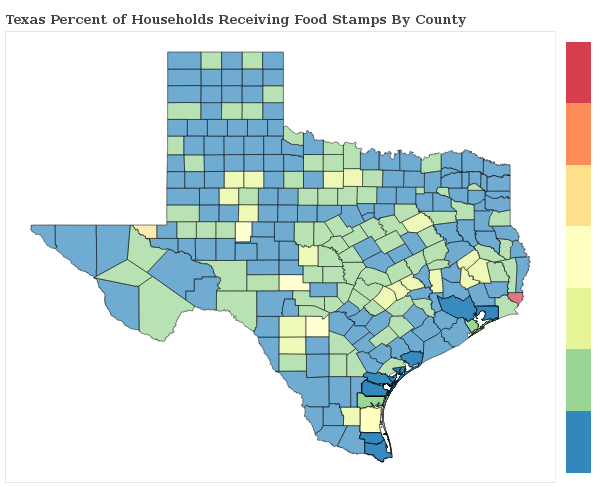
What percent of Households Receive Food Stamps in The Woodlands?
The percentage of households receiving food stamps in the last year in The Woodlands is 1.4%.
How Many Households in The Woodlands Receive Food Stamps?
There are 559 households out of 39894 in The Woodlands receiving food stamps.
Where does The Woodlands Rank in Comparison to Other Texas Cities for HouseHolds Receiving Food Stamps?
The Woodlands ranks 612th out of 983 cities and towns in Texas for the least number of households receiving food stamps. A smaller numeric rank indicates a lower percentage of homes receive food stamps.
Here is a comparison of Food Stamps by city(minimum 1,000 residents) in Harris County, Montgomery County.
| City | Food Stamps | Details |
|---|---|---|
Aldine |
1.0% |
37 of 3,888 Aldine households received food stamps within the past year. |
Atascocita |
1.3% |
308 of 23,706 Atascocita households received food stamps within the past year. |
Barrett |
0.0% |
0 of 1,194 Barrett households received food stamps within the past year. |
Bellaire |
1.4% |
91 of 6,611 Bellaire households received food stamps within the past year. |
Bunker Hill Village |
0.5% |
6 of 1,198 Bunker Hill Village households received food stamps within the past year. |
Channelview |
0.6% |
67 of 11,892 Channelview households received food stamps within the past year. |
Cloverleaf |
0.5% |
32 of 6,588 Cloverleaf households received food stamps within the past year. |
Crosby |
1.0% |
10 of 983 Crosby households received food stamps within the past year. |
Deer Park |
1.5% |
172 of 11,322 Deer Park households received food stamps within the past year. |
El Lago |
0.4% |
4 of 1,036 El Lago households received food stamps within the past year. |
Galena Park |
1.0% |
31 of 2,974 Galena Park households received food stamps within the past year. |
Hedwig Village |
0.9% |
9 of 980 Hedwig Village households received food stamps within the past year. |
Highlands |
0.0% |
0 of 2,658 Highlands households received food stamps within the past year. |
Humble |
2.7% |
154 of 5,626 Humble households received food stamps within the past year. |
Hunters Creek Village |
0.8% |
13 of 1,602 Hunters Creek Village households received food stamps within the past year. |
Jacinto City |
1.2% |
37 of 3,170 Jacinto City households received food stamps within the past year. |
Jersey Village |
1.5% |
56 of 3,687 Jersey Village households received food stamps within the past year. |
La Porte |
1.0% |
127 of 12,491 La Porte households received food stamps within the past year. |
Nassau Bay |
0.6% |
12 of 1,860 Nassau Bay households received food stamps within the past year. |
Pasadena |
2.0% |
961 of 48,931 Pasadena households received food stamps within the past year. |
Piney Point Village |
1.4% |
17 of 1,177 Piney Point Village households received food stamps within the past year. |
Sheldon |
2.9% |
12 of 410 Sheldon households received food stamps within the past year. |
South Houston |
1.0% |
47 of 4,617 South Houston households received food stamps within the past year. |
Southside Place |
1.8% |
11 of 597 Southside Place households received food stamps within the past year. |
Spring |
1.2% |
231 of 19,611 Spring households received food stamps within the past year. |
Spring Valley Village |
0.0% |
0 of 1,457 Spring Valley Village households received food stamps within the past year. |
Taylor Lake Village |
0.0% |
0 of 1,283 Taylor Lake Village households received food stamps within the past year. |
Webster |
0.8% |
38 of 4,519 Webster households received food stamps within the past year. |
West University Place |
0.9% |
49 of 5,470 West University Place households received food stamps within the past year. |