West Virginia Food Stamps
How does West Virginia rank for percentage of homes receiving food stamps?
West Virginia ranks 4th out of 50 states for lowest percentage of households receiving food stamps at 1.2%. The study is based on a total of 737,671 West Virginian households who reported whether or not food stamps were received.
How many West Virginia households received food stamps in the past year?
9,022 households in West Virginia received food stamps within the last year.
West Virginia Food Stamps Received Map

West Virginia Food Stamps Received Map
Food Stamps Received By County
The percentage of households receiving food stamps in West Virginia varies by county.
Applying For West Virginia Food Stamp Programs
How do I apply for food stamps in West Virginia?
There are 5 government food-related benefits that you may apply for as a resident of West Virginia.
Want to explore more government assistance programs? Browse all government benefits available to West Virginia residents.
West Virginia Percentage of Households Receiving Food Stamps by City Statistics
How does the percentage of homes receiving food stamps compare across the largest cities in West Virginia?
| City | Food Stamps | Details |
|---|---|---|
Beckley |
0.9% |
Beckley ranks 72nd of 155 among cities in West Virginia based on a sample of 7,408 West Virginian households in Beckley. |
Charleston |
1.6% |
Charleston ranks 108th of 155 among cities in West Virginia based on a sample of 22,042 West Virginian households in Charleston. |
Clarksburg |
1.1% |
Clarksburg ranks 84th of 155 among cities in West Virginia based on a sample of 6,371 West Virginian households in Clarksburg. |
Fairmont |
1.3% |
Fairmont ranks 92nd of 155 among cities in West Virginia based on a sample of 7,490 West Virginian households in Fairmont. |
Huntington |
1.0% |
Huntington ranks 79th of 155 among cities in West Virginia based on a sample of 20,309 West Virginian households in Huntington. |
Martinsburg |
2.6% |
Martinsburg ranks 137th of 155 among cities in West Virginia based on a sample of 7,156 West Virginian households in Martinsburg. |
Morgantown |
1.4% |
Morgantown ranks 96th of 155 among cities in West Virginia based on a sample of 10,086 West Virginian households in Morgantown. |
Parkersburg |
2.0% |
Parkersburg ranks 123rd of 155 among cities in West Virginia based on a sample of 13,104 West Virginian households in Parkersburg. |
Weirton |
1.3% |
Weirton ranks 93rd of 155 among cities in West Virginia based on a sample of 8,309 West Virginian households in Weirton. |
Wheeling |
1.5% |
Wheeling ranks 104th of 155 among cities in West Virginia based on a sample of 12,233 West Virginian households in Wheeling. |
Research & Reports
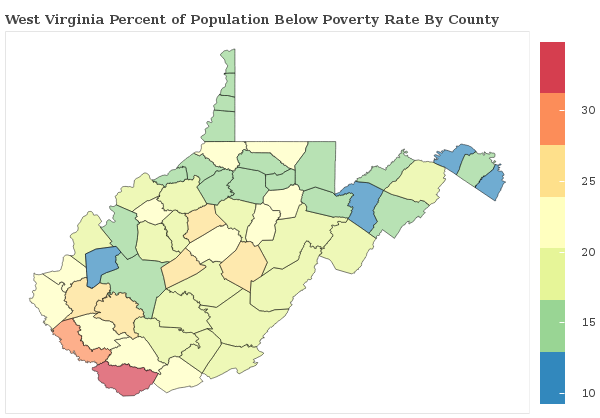
West Virginia Poverty Statistics
Which areas have the highest rate of poverty in West Virginia? We breakdown the poverty rate by city and county across West Virginia and rank communities with the highest and lowest concentrations of residents living below the poverty line.
West Virginia Poverty Statistics
West Virginia Social Security
West Virginia Social Security Statistics
West Virginia Social SecuritySocial Security Payments in West Virginia
How are the Social Security Payments distributed throughout West Virginia? We breakdown social security benefits by city and county statewide and rank communities with the most and least social security income per capita.
West Virginia Social Security
Food Stamps in America
Which areas receive the most food stamp public assistance in your state? We breakdown over 3,000 counties nationwide and rank communities with the most and least food and nutrional supplements given to residents.
See Food Stamp Statistics2018 West Virginia Poverty Line
| Household Size | Poverty Level |
|---|---|
| 1 | $12,140 |
| 2 | $16,460 |
| 3 | $20,780 |
| 4 | $25,100 |
| 5 | $29,420 |
| 6 | $33,740 |
| Per Additional | +$4,320 |
The poverty line for West Virginia in 2018 is based on the federal guidelines, which begins at $12,140 for a single person, adding $4,320 for each additional person.
Poverty In America
