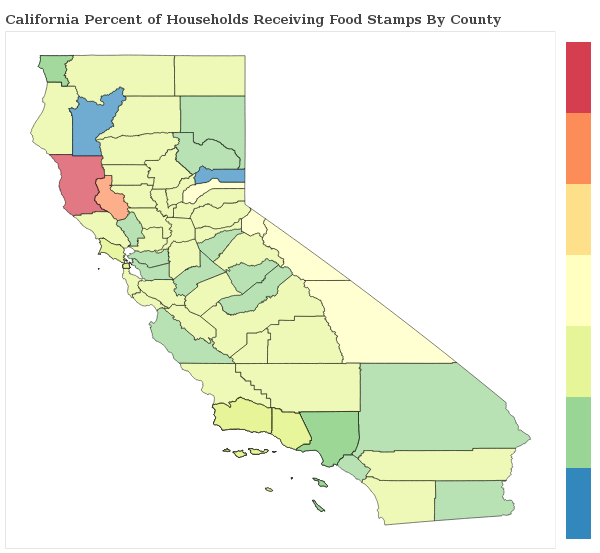
1.6% of Households Receive Food Stamps in Daly City, California
Food Stamps in Daly City, California
What percent of Households Receive Food Stamps in Daly City?
The percentage of households receiving food stamps in the last year in Daly City is 1.6%.
How Many Households in Daly City Receive Food Stamps?
There are 507 households out of 31318 in Daly City receiving food stamps.
Where does Daly City Rank in Comparison to Other California Cities for HouseHolds Receiving Food Stamps?
Daly City ranks 653rd out of 1018 cities and towns in California for the least number of households receiving food stamps. A smaller numeric rank indicates a lower percentage of homes receive food stamps.
How do other cities in San Mateo County compare to Daly City when it comes to the percentage of homes receiving Food Stamps?
Cities must have a minimum of 1,000 residents to qualify
| City | Food Stamps | Details |
|---|---|---|
Colma |
0.0% |
0 of 464 Colma households received food stamps within the past year. |
Daly City |
1.6% |
507 of 31,318 Daly City households received food stamps within the past year. |
East Palo Alto |
1.2% |
88 of 7,534 East Palo Alto households received food stamps within the past year. |
El Granada |
1.7% |
35 of 2,082 El Granada households received food stamps within the past year. |
Atherton |
1.1% |
26 of 2,320 Atherton households received food stamps within the past year. |
Belmont |
0.7% |
77 of 10,294 Belmont households received food stamps within the past year. |
Brisbane |
0.9% |
16 of 1,871 Brisbane households received food stamps within the past year. |
Broadmoor |
0.0% |
0 of 1,560 Broadmoor households received food stamps within the past year. |
Burlingame |
1.3% |
150 of 11,987 Burlingame households received food stamps within the past year. |
Emerald Lake Hills |
2.0% |
32 of 1,575 Emerald Lake Hills households received food stamps within the past year. |
Foster City |
1.7% |
214 of 12,792 Foster City households received food stamps within the past year. |
Half Moon Bay |
0.8% |
38 of 4,858 Half Moon Bay households received food stamps within the past year. |
Highlands-Baywood Park |
0.8% |
12 of 1,458 Highlands-Baywood Park households received food stamps within the past year. |
Hillsborough |
0.8% |
31 of 3,676 Hillsborough households received food stamps within the past year. |
Ladera |
3.0% |
15 of 505 Ladera households received food stamps within the past year. |
Menlo Park |
1.5% |
180 of 11,861 Menlo Park households received food stamps within the past year. |
Millbrae |
1.8% |
146 of 8,223 Millbrae households received food stamps within the past year. |
Montara |
8.7% |
94 of 1,077 Montara households received food stamps within the past year. |
Moss Beach |
0.8% |
10 of 1,211 Moss Beach households received food stamps within the past year. |
North Fair Oaks |
1.8% |
75 of 4,211 North Fair Oaks households received food stamps within the past year. |
Pacifica |
1.3% |
189 of 14,080 Pacifica households received food stamps within the past year. |
Portola Valley |
0.8% |
15 of 1,797 Portola Valley households received food stamps within the past year. |
Redwood City |
1.2% |
365 of 30,088 Redwood City households received food stamps within the past year. |
San Bruno |
1.7% |
260 of 15,000 San Bruno households received food stamps within the past year. |
San Carlos |
1.3% |
144 of 11,367 San Carlos households received food stamps within the past year. |
San Mateo |
1.5% |
597 of 38,546 San Mateo households received food stamps within the past year. |
South San Francisco |
1.3% |
261 of 20,712 South San Francisco households received food stamps within the past year. |
West Menlo Park |
3.0% |
37 of 1,237 West Menlo Park households received food stamps within the past year. |
Woodside |
2.9% |
55 of 1,911 Woodside households received food stamps within the past year. |
