
How Many Receive Food Assistance?
What percentage of households receive food stamps in the United States?
Received Food Stamps
The percentage of households receiving food stamps in the United States is 1.7%.
In the United States, 1.7% of households received food stamps in the past year.
Food Stamp Statistics By State
| Rank | State | Percent Receiving Food Stamps |
|---|---|---|
1st |
Maine |
1.1% |
2nd |
Alaska |
1.2% |
3rd |
Vermont |
1.2% |
4th |
West Virginia |
1.2% |
5th |
Utah |
1.2% |
6th |
New Mexico |
1.3% |
7th |
New Hampshire |
1.3% |
8th |
Indiana |
1.3% |
9th |
South Dakota |
1.3% |
10th |
Nebraska |
1.3% |
11th |
Nevada |
1.4% |
12th |
Texas |
1.4% |
13th |
Rhode Island |
1.4% |
14th |
Wisconsin |
1.4% |
15th |
Wyoming |
1.4% |
16th |
Colorado |
1.4% |
17th |
New Jersey |
1.4% |
18th |
Louisiana |
1.4% |
19th |
Kansas |
1.4% |
20th |
Connecticut |
1.4% |
21st |
Ohio |
1.5% |
22nd |
California |
1.5% |
23rd |
Mississippi |
1.5% |
24th |
Tennessee |
1.5% |
25th |
Oregon |
1.5% |
26th |
Minnesota |
1.5% |
27th |
Illinois |
1.5% |
28th |
North Dakota |
1.6% |
29th |
Hawaii |
1.6% |
30th |
North Carolina |
1.6% |
31st |
Washington |
1.6% |
32nd |
Kentucky |
1.6% |
33rd |
Idaho |
1.6% |
34th |
Montana |
1.6% |
35th |
Arkansas |
1.7% |
36th |
Massachusetts |
1.7% |
37th |
Iowa |
1.7% |
38th |
Pennsylvania |
1.7% |
39th |
Virginia |
1.7% |
40th |
Missouri |
1.7% |
41st |
Arizona |
1.7% |
42nd |
Georgia |
1.7% |
43rd |
Michigan |
1.8% |
44th |
New York |
2.0% |
45th |
South Carolina |
2.1% |
46th |
Oklahoma |
2.1% |
47th |
Maryland |
2.2% |
48th |
Florida |
2.3% |
49th |
Alabama |
2.9% |
50th |
Delaware |
2.9% |
Research & Reports
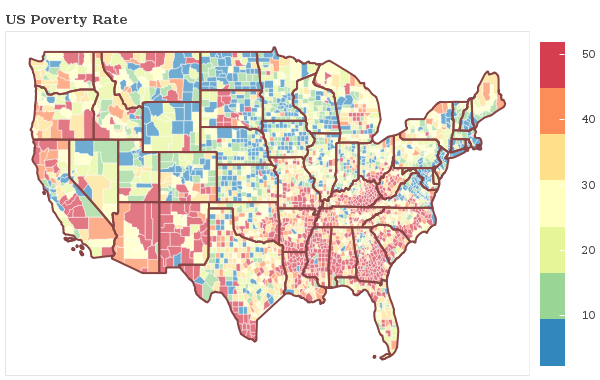
Poverty Rate
Where are the most poverty-stricken areas in your state? We breakdown over 3,000 counties nationwide and show the rank the best and worst communities by poverty rate in your area.
See Poverty Statistics