Michigan Food Stamps
How does Michigan rank for percentage of homes receiving food stamps?
Michigan ranks 43rd out of 50 states for lowest percentage of households receiving food stamps at 1.8%. The study is based on a total of 3,888,646 Michigander households who reported whether or not food stamps were received.
How many Michigan households received food stamps in the past year?
69,373 households in Michigan received food stamps within the last year.
Michigan Food Stamps Received Map
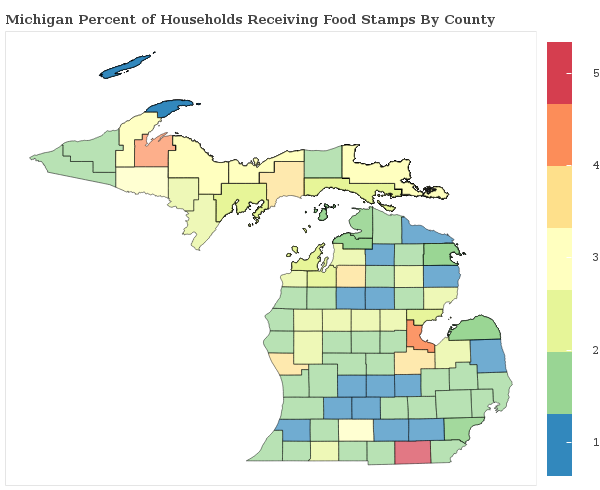
Michigan Food Stamps Received Map
Food Stamps Received By County
The percentage of households receiving food stamps in Michigan varies by county.
Applying For Michigan Food Stamp Programs
How do I apply for food stamps in Michigan?
There are 5 government food-related benefits that you may apply for as a resident of Michigan.
Want to explore more government assistance programs? Browse all government benefits available to Michigan residents.
Michigan Percentage of Households Receiving Food Stamps by City Statistics
How does the percentage of homes receiving food stamps compare across the largest cities in Michigan?
| City | Food Stamps | Details |
|---|---|---|
Ann Arbor |
1.3% |
Ann Arbor ranks 173rd of 428 among cities in Michigan based on a sample of 47,524 Michigander households in Ann Arbor. |
Dearborn |
1.2% |
Dearborn ranks 161st of 428 among cities in Michigan based on a sample of 30,814 Michigander households in Dearborn. |
Detroit |
2.5% |
Detroit ranks 325th of 428 among cities in Michigan based on a sample of 258,471 Michigander households in Detroit. |
Flint |
2.0% |
Flint ranks 288th of 428 among cities in Michigan based on a sample of 39,780 Michigander households in Flint. |
Grand Rapids |
1.8% |
Grand Rapids ranks 273rd of 428 among cities in Michigan based on a sample of 73,434 Michigander households in Grand Rapids. |
Lansing |
2.2% |
Lansing ranks 313th of 428 among cities in Michigan based on a sample of 48,726 Michigander households in Lansing. |
Livonia |
1.6% |
Livonia ranks 217th of 428 among cities in Michigan based on a sample of 37,186 Michigander households in Livonia. |
Sterling Heights |
1.5% |
Sterling Heights ranks 203rd of 428 among cities in Michigan based on a sample of 49,838 Michigander households in Sterling Heights. |
Troy |
1.2% |
Troy ranks 159th of 428 among cities in Michigan based on a sample of 31,520 Michigander households in Troy. |
Warren |
1.7% |
Warren ranks 234th of 428 among cities in Michigan based on a sample of 53,436 Michigander households in Warren. |
Research & Reports
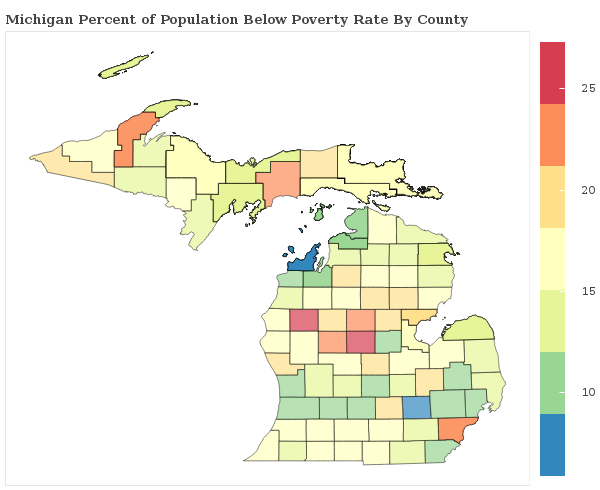
Michigan Poverty Statistics
Which areas have the highest rate of poverty in Michigan? We breakdown the poverty rate by city and county across Michigan and rank communities with the highest and lowest concentrations of residents living below the poverty line.
Michigan Poverty Statistics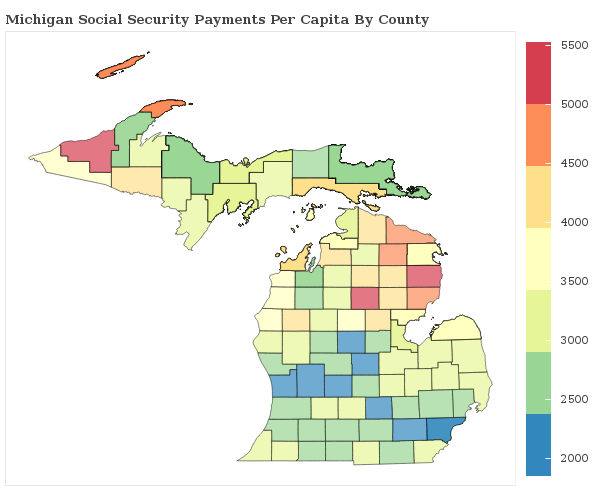
Social Security Payments in Michigan
How are the Social Security Payments distributed throughout Michigan? We breakdown social security benefits by city and county statewide and rank communities with the most and least social security income per capita.
Michigan Social Security
Food Stamps in America
Which areas receive the most food stamp public assistance in your state? We breakdown over 3,000 counties nationwide and rank communities with the most and least food and nutrional supplements given to residents.
See Food Stamp Statistics2018 Michigan Poverty Line
| Household Size | Poverty Level |
|---|---|
| 1 | $12,140 |
| 2 | $16,460 |
| 3 | $20,780 |
| 4 | $25,100 |
| 5 | $29,420 |
| 6 | $33,740 |
| Per Additional | +$4,320 |
The poverty line for Michigan in 2018 is based on the federal guidelines, which begins at $12,140 for a single person, adding $4,320 for each additional person.
Poverty In America
