2.0% of Households Receive Food Stamps in Flint, Michigan
Food Stamps in Flint, Michigan
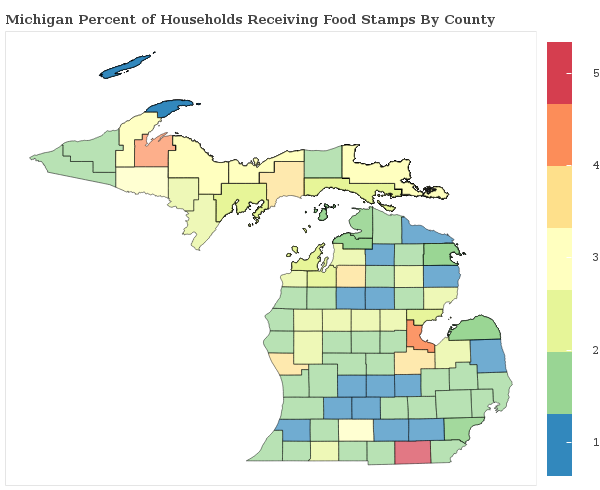
What percent of Households Receive Food Stamps in Flint?
The percentage of households receiving food stamps in the last year in Flint is 2.0%.
How Many Households in Flint Receive Food Stamps?
There are 781 households out of 39780 in Flint receiving food stamps.
Where does Flint Rank in Comparison to Other Michigan Cities for HouseHolds Receiving Food Stamps?
Flint ranks 288th out of 428 cities and towns in Michigan for the least number of households receiving food stamps. A smaller numeric rank indicates a lower percentage of homes receive food stamps.
How do other cities in Genesee County compare to Flint when it comes to the percentage of homes receiving Food Stamps?
Cities must have a minimum of 1,000 residents to qualify
| City | Food Stamps | Details |
|---|---|---|
Argentine |
0.0% |
0 of 990 Argentine households received food stamps within the past year. |
Beecher |
1.7% |
62 of 3,597 Beecher households received food stamps within the past year. |
Burton |
1.3% |
154 of 11,663 Burton households received food stamps within the past year. |
Clio |
0.0% |
0 of 1,321 Clio households received food stamps within the past year. |
Davison |
1.0% |
23 of 2,399 Davison households received food stamps within the past year. |
Flint |
2.0% |
781 of 39,780 Flint households received food stamps within the past year. |
Flushing |
2.1% |
72 of 3,441 Flushing households received food stamps within the past year. |
Goodrich |
1.8% |
12 of 671 Goodrich households received food stamps within the past year. |
Grand Blanc |
1.1% |
40 of 3,621 Grand Blanc households received food stamps within the past year. |
Lake Fenton |
1.3% |
30 of 2,344 Lake Fenton households received food stamps within the past year. |
Linden |
1.3% |
19 of 1,476 Linden households received food stamps within the past year. |
Montrose |
0.8% |
5 of 640 Montrose households received food stamps within the past year. |
Mount Morris |
0.8% |
9 of 1,194 Mount Morris households received food stamps within the past year. |
Otisville |
0.4% |
2 of 455 Otisville households received food stamps within the past year. |
Swartz Creek |
0.5% |
11 of 2,414 Swartz Creek households received food stamps within the past year. |