Social Security Payments
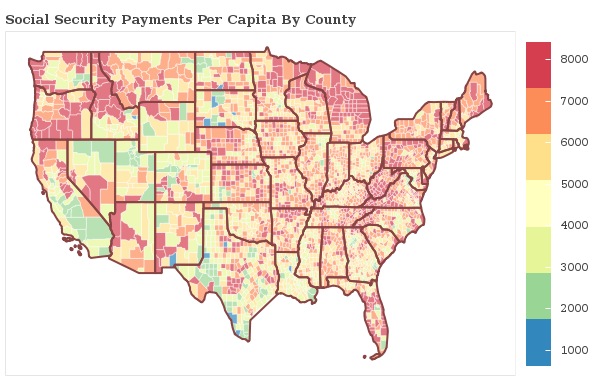
Social Security Statistics By State
| Rank | State | Per Capita Payment |
|---|---|---|
1st |
Alaska |
$1,232.11 |
2nd |
Utah |
$1,496.75 |
3rd |
Texas |
$1,559.25 |
4th |
California |
$1,636.17 |
5th |
Colorado |
$1,776.71 |
6th |
Georgia |
$1,867.90 |
7th |
Louisiana |
$1,869.08 |
8th |
Maryland |
$1,910.12 |
9th |
North Dakota |
$1,969.52 |
10th |
Nevada |
$2,003.63 |
11th |
Illinois |
$2,004.08 |
12th |
Virginia |
$2,037.42 |
13th |
South Dakota |
$2,049.89 |
14th |
Massachusetts |
$2,085.80 |
15th |
New Mexico |
$2,128.93 |
16th |
New York |
$2,129.43 |
17th |
Wyoming |
$2,131.89 |
18th |
Hawaii |
$2,135.75 |
19th |
Oklahoma |
$2,140.99 |
19th |
Nebraska |
$2,140.65 |
21st |
Mississippi |
$2,142.52 |
22nd |
Washington |
$2,154.68 |
23rd |
Idaho |
$2,180.42 |
24th |
Minnesota |
$2,189.97 |
25th |
Kansas |
$2,213.57 |
26th |
New Jersey |
$2,222.88 |
27th |
Ohio |
$2,260.26 |
28th |
Rhode Island |
$2,272.65 |
29th |
North Carolina |
$2,288.39 |
30th |
Indiana |
$2,325.79 |
31st |
Iowa |
$2,335.38 |
32nd |
Connecticut |
$2,349.72 |
33rd |
Kentucky |
$2,367.27 |
33rd |
Missouri |
$2,367.45 |
35th |
Tennessee |
$2,374.95 |
36th |
Arizona |
$2,383.87 |
37th |
Montana |
$2,434.20 |
38th |
Wisconsin |
$2,441.45 |
39th |
Alabama |
$2,455.53 |
40th |
Oregon |
$2,466.21 |
41st |
Arkansas |
$2,473.76 |
42nd |
South Carolina |
$2,530.34 |
43rd |
New Hampshire |
$2,565.01 |
44th |
Pennsylvania |
$2,599.20 |
45th |
Delaware |
$2,607.24 |
46th |
Florida |
$2,632.93 |
47th |
Michigan |
$2,644.16 |
48th |
Maine |
$2,651.69 |
49th |
Vermont |
$2,659.84 |
50th |
West Virginia |
$2,993.79 |
Research & Reports
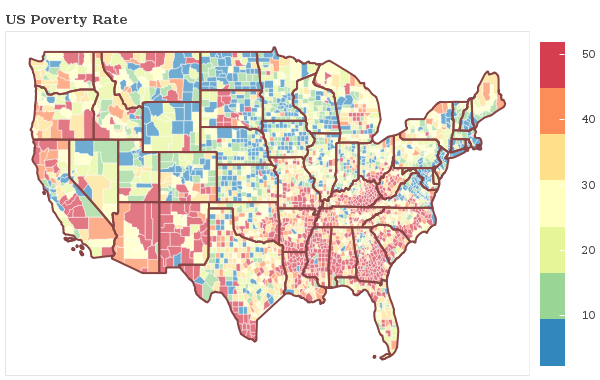
Poverty Rate
Where are the most poverty-stricken areas in your state? We breakdown over 3,000 counties nationwide and show the rank the best and worst communities by poverty rate in your area.
See Poverty StatisticsPoverty In America
