Pennsylvania Social Security
How does Pennsylvania rank for social security payments?
Pennsylvania ranks 44th out of 50 states for lowest Social Security dollars per capita at $2,599.20. The study is based on a total of 12,790,505 Pennsylvanians who received a reported $33,245,063,400 in Social Security Payments in the past year.
Pennsylvania Social Security Payments By County
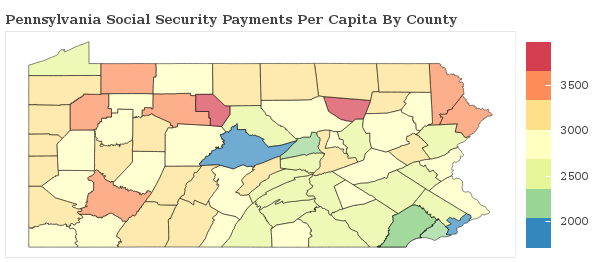
Pennsylvania Social Security Received Map
Social Security Received By County
The percentage of households receiving social security in Pennsylvania varies by county.
Applying For Social Security in Pennsylvania
How do I apply for Social Security Benefits in Pennsylvania?
Social Security Benefits are administered by the Federal government, and are available to citizens of all states including Pennsylvania. There are 17 government social security benefits that you may apply for as a resident of Pennsylvania.
Want to explore more government assistance programs? Browse all government benefits available to Pennsylvania residents or all Social Security Benefits
Pennsylvania Social Security Payments by City Statistics
How do the per capita social security payments compare across the largest cities in Pennsylvania?
| City | Payments | Details |
|---|---|---|
Allentown |
$1,657.15 |
Allentown ranks 83rd of 963 among cities in Pennsylvania with the lowest social security payments. Allentown residents received $199,070,400 in social security payments in the past year. |
Bethlehem |
$2,351.04 |
Bethlehem ranks 289th of 963 among cities in Pennsylvania with the lowest social security payments. Bethlehem residents received $176,892,400 in social security payments in the past year. |
Erie |
$2,155.91 |
Erie ranks 213th of 963 among cities in Pennsylvania with the lowest social security payments. Erie residents received $213,370,800 in social security payments in the past year. |
Harrisburg |
$1,478.28 |
Harrisburg ranks 60th of 963 among cities in Pennsylvania with the lowest social security payments. Harrisburg residents received $72,846,800 in social security payments in the past year. |
Lancaster |
$1,473.17 |
Lancaster ranks 59th of 963 among cities in Pennsylvania with the lowest social security payments. Lancaster residents received $87,736,400 in social security payments in the past year. |
Levittown |
$2,572.04 |
Levittown ranks 380th of 963 among cities in Pennsylvania with the lowest social security payments. Levittown residents received $133,604,700 in social security payments in the past year. |
Philadelphia |
$1,718.81 |
Philadelphia ranks 99th of 963 among cities in Pennsylvania with the lowest social security payments. Philadelphia residents received $2,697,944,000 in social security payments in the past year. |
Pittsburgh |
$2,058.68 |
Pittsburgh ranks 184th of 963 among cities in Pennsylvania with the lowest social security payments. Pittsburgh residents received $627,920,600 in social security payments in the past year. |
Reading |
$1,445.43 |
Reading ranks 55th of 963 among cities in Pennsylvania with the lowest social security payments. Reading residents received $127,595,600 in social security payments in the past year. |
Scranton |
$2,317.63 |
Scranton ranks 277th of 963 among cities in Pennsylvania with the lowest social security payments. Scranton residents received $177,586,200 in social security payments in the past year. |
Research & Reports
Social Security Statistics
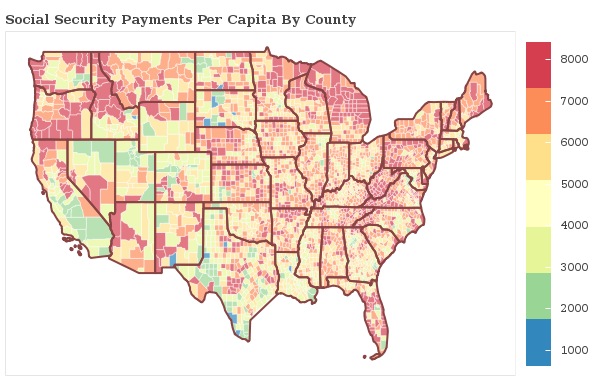
How does Pennsylvania compare nationally? See which states receive the most social security payments.
We breakdown over 3,000 counties nationwide and rank states with the most and least social security payments given to residents.
Social Security Statistics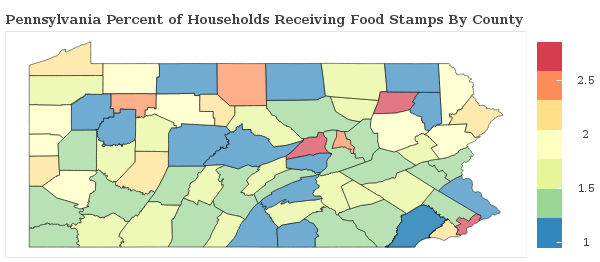
Food Stamp Recipients in Pennsylvania
Which areas receive the most food stamp public assistance in Pennsylvania? We breakdown food stamps by city and county statewide and rank communities with the most and least food and nutrional supplements given to residents.
Pennsylvania Food Stamp Statistics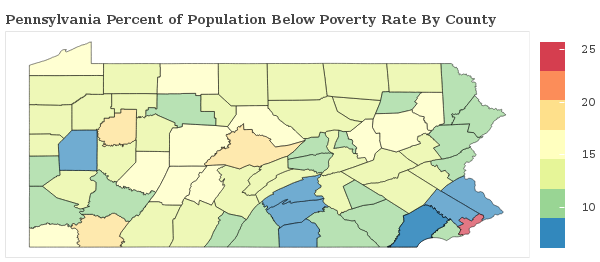
Pennsylvania Poverty Statistics
Which areas have the highest rate of poverty in Pennsylvania? We breakdown the poverty rate by city and county across Pennsylvania and rank communities with the highest and lowest concentrations of residents living below the poverty line.
Pennsylvania Poverty Statistics2018 Pennsylvania Poverty Line
| Household Size | Poverty Level |
|---|---|
| 1 | $12,140 |
| 2 | $16,460 |
| 3 | $20,780 |
| 4 | $25,100 |
| 5 | $29,420 |
| 6 | $33,740 |
| Per Additional | +$4,320 |
The poverty line for Pennsylvania in 2018 is based on the federal guidelines, which begins at $12,140 for a single person, adding $4,320 for each additional person.
Poverty In America
