Pennsylvania Food Stamps
How does Pennsylvania rank for percentage of homes receiving food stamps?
Pennsylvania ranks 38th out of 50 states for lowest percentage of households receiving food stamps at 1.7%. The study is based on a total of 5,007,442 Pennsylvanian households who reported whether or not food stamps were received.
How many Pennsylvania households received food stamps in the past year?
84,938 households in Pennsylvania received food stamps within the last year.
Pennsylvania Food Stamps Received Map
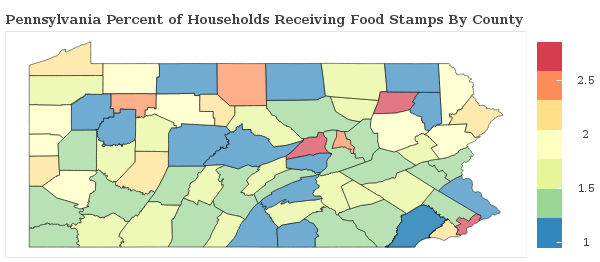
Pennsylvania Food Stamps Received Map
Food Stamps Received By County
The percentage of households receiving food stamps in Pennsylvania varies by county.
Applying For Pennsylvania Food Stamp Programs
How do I apply for food stamps in Pennsylvania?
There are 5 government food-related benefits that you may apply for as a resident of Pennsylvania.
Want to explore more government assistance programs? Browse all government benefits available to Pennsylvania residents.
Pennsylvania Percentage of Households Receiving Food Stamps by City Statistics
How does the percentage of homes receiving food stamps compare across the largest cities in Pennsylvania?
| City | Food Stamps | Details |
|---|---|---|
Allentown |
1.6% |
Allentown ranks 575th of 959 among cities in Pennsylvania based on a sample of 41,935 Pennsylvanian households in Allentown. |
Bethlehem |
1.3% |
Bethlehem ranks 489th of 959 among cities in Pennsylvania based on a sample of 28,936 Pennsylvanian households in Bethlehem. |
Erie |
2.8% |
Erie ranks 807th of 959 among cities in Pennsylvania based on a sample of 40,507 Pennsylvanian households in Erie. |
Harrisburg |
1.9% |
Harrisburg ranks 658th of 959 among cities in Pennsylvania based on a sample of 20,188 Pennsylvanian households in Harrisburg. |
Lancaster |
2.0% |
Lancaster ranks 685th of 959 among cities in Pennsylvania based on a sample of 21,886 Pennsylvanian households in Lancaster. |
Levittown |
0.8% |
Levittown ranks 297th of 959 among cities in Pennsylvania based on a sample of 17,935 Pennsylvanian households in Levittown. |
Philadelphia |
2.8% |
Philadelphia ranks 799th of 959 among cities in Pennsylvania based on a sample of 591,280 Pennsylvanian households in Philadelphia. |
Pittsburgh |
1.7% |
Pittsburgh ranks 614th of 959 among cities in Pennsylvania based on a sample of 134,820 Pennsylvanian households in Pittsburgh. |
Reading |
1.7% |
Reading ranks 596th of 959 among cities in Pennsylvania based on a sample of 28,980 Pennsylvanian households in Reading. |
Scranton |
1.5% |
Scranton ranks 560th of 959 among cities in Pennsylvania based on a sample of 29,528 Pennsylvanian households in Scranton. |
Research & Reports
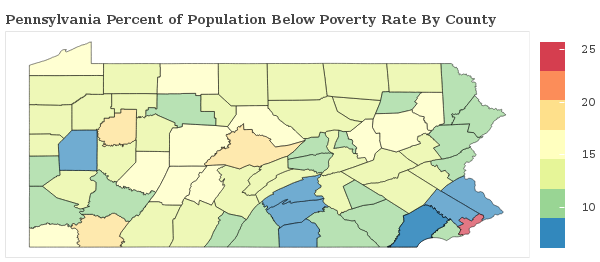
Pennsylvania Poverty Statistics
Which areas have the highest rate of poverty in Pennsylvania? We breakdown the poverty rate by city and county across Pennsylvania and rank communities with the highest and lowest concentrations of residents living below the poverty line.
Pennsylvania Poverty Statistics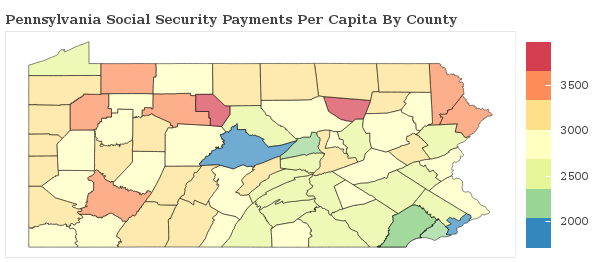
Social Security Payments in Pennsylvania
How are the Social Security Payments distributed throughout Pennsylvania? We breakdown social security benefits by city and county statewide and rank communities with the most and least social security income per capita.
Pennsylvania Social Security
Food Stamps in America
Which areas receive the most food stamp public assistance in your state? We breakdown over 3,000 counties nationwide and rank communities with the most and least food and nutrional supplements given to residents.
See Food Stamp Statistics2018 Pennsylvania Poverty Line
| Household Size | Poverty Level |
|---|---|
| 1 | $12,140 |
| 2 | $16,460 |
| 3 | $20,780 |
| 4 | $25,100 |
| 5 | $29,420 |
| 6 | $33,740 |
| Per Additional | +$4,320 |
The poverty line for Pennsylvania in 2018 is based on the federal guidelines, which begins at $12,140 for a single person, adding $4,320 for each additional person.
Poverty In America
