1.7% of Households Receive Food Stamps in Pittsburgh, Pennsylvania
Food Stamps in Pittsburgh, Pennsylvania
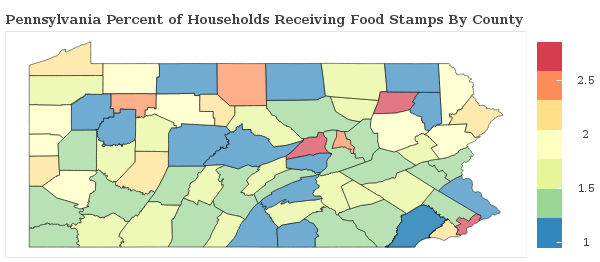
What percent of Households Receive Food Stamps in Pittsburgh?
The percentage of households receiving food stamps in the last year in Pittsburgh is 1.7%.
How Many Households in Pittsburgh Receive Food Stamps?
There are 2349 households out of 134820 in Pittsburgh receiving food stamps.
Where does Pittsburgh Rank in Comparison to Other Pennsylvania Cities for HouseHolds Receiving Food Stamps?
Pittsburgh ranks 614th out of 959 cities and towns in Pennsylvania for the least number of households receiving food stamps. A smaller numeric rank indicates a lower percentage of homes receive food stamps.
How do other cities in Allegheny County compare to Pittsburgh when it comes to the percentage of homes receiving Food Stamps?
Cities must have a minimum of 1,000 residents to qualify
| City | Food Stamps | Details |
|---|---|---|
Aspinwall |
0.0% |
0 of 1,269 Aspinwall households received food stamps within the past year. |
Avalon |
1.6% |
40 of 2,515 Avalon households received food stamps within the past year. |
Bairdford |
0.0% |
0 of 387 Bairdford households received food stamps within the past year. |
Bakerstown |
1.7% |
17 of 982 Bakerstown households received food stamps within the past year. |
Baldwin |
2.7% |
224 of 8,217 Baldwin households received food stamps within the past year. |
Bell Acres |
0.0% |
0 of 538 Bell Acres households received food stamps within the past year. |
Bellevue |
2.2% |
98 of 4,428 Bellevue households received food stamps within the past year. |
Ben Avon |
0.5% |
4 of 760 Ben Avon households received food stamps within the past year. |
Bethel Park |
1.7% |
227 of 13,489 Bethel Park households received food stamps within the past year. |
Blawnox |
0.7% |
6 of 835 Blawnox households received food stamps within the past year. |
Brackenridge |
1.6% |
23 of 1,440 Brackenridge households received food stamps within the past year. |
Braddock |
17.5% |
122 of 696 Braddock households received food stamps within the past year. |
Braddock Hills |
3.5% |
33 of 956 Braddock Hills households received food stamps within the past year. |
Bradford Woods |
1.7% |
8 of 471 Bradford Woods households received food stamps within the past year. |
Brentwood |
1.5% |
58 of 3,976 Brentwood households received food stamps within the past year. |
Bridgeville |
0.3% |
7 of 2,528 Bridgeville households received food stamps within the past year. |
Allison Park |
2.1% |
185 of 8,860 Allison Park households received food stamps within the past year. |
Carnegie |
1.3% |
49 of 3,879 Carnegie households received food stamps within the past year. |
Carnot-Moon |
1.1% |
54 of 4,801 Carnot-Moon households received food stamps within the past year. |
Castle Shannon |
1.3% |
49 of 3,894 Castle Shannon households received food stamps within the past year. |
Cheswick |
0.0% |
0 of 826 Cheswick households received food stamps within the past year. |
Churchill |
0.6% |
7 of 1,270 Churchill households received food stamps within the past year. |
Clairton |
2.0% |
60 of 2,991 Clairton households received food stamps within the past year. |
Coraopolis |
2.0% |
56 of 2,808 Coraopolis households received food stamps within the past year. |
Crafton |
1.2% |
35 of 2,800 Crafton households received food stamps within the past year. |
Curtisville |
0.0% |
0 of 559 Curtisville households received food stamps within the past year. |
Dormont |
1.6% |
65 of 4,017 Dormont households received food stamps within the past year. |
Dravosburg |
3.2% |
29 of 912 Dravosburg households received food stamps within the past year. |
Duquesne |
1.8% |
40 of 2,280 Duquesne households received food stamps within the past year. |
East McKeesport |
1.8% |
18 of 975 East McKeesport households received food stamps within the past year. |
East Pittsburgh |
16.6% |
132 of 797 East Pittsburgh households received food stamps within the past year. |
Edgewood |
1.4% |
22 of 1,569 Edgewood households received food stamps within the past year. |
Edgeworth |
0.3% |
2 of 712 Edgeworth households received food stamps within the past year. |
Elizabeth |
1.4% |
9 of 636 Elizabeth households received food stamps within the past year. |
Emsworth |
1.4% |
17 of 1,203 Emsworth households received food stamps within the past year. |
Enlow |
0.0% |
0 of 497 Enlow households received food stamps within the past year. |
Etna |
0.5% |
7 of 1,484 Etna households received food stamps within the past year. |
Forest Hills |
2.9% |
92 of 3,162 Forest Hills households received food stamps within the past year. |
Fox Chapel |
0.0% |
0 of 1,869 Fox Chapel households received food stamps within the past year. |
Franklin Park |
1.7% |
88 of 5,223 Franklin Park households received food stamps within the past year. |
Gibsonia |
4.6% |
44 of 947 Gibsonia households received food stamps within the past year. |
Glassport |
3.0% |
61 of 2,029 Glassport households received food stamps within the past year. |
Glenshaw |
0.3% |
13 of 3,756 Glenshaw households received food stamps within the past year. |
Greenock |
0.0% |
0 of 862 Greenock households received food stamps within the past year. |
Green Tree |
2.7% |
56 of 2,091 Green Tree households received food stamps within the past year. |
Heidelberg |
0.0% |
0 of 628 Heidelberg households received food stamps within the past year. |
Homestead |
0.6% |
8 of 1,395 Homestead households received food stamps within the past year. |
Imperial |
3.2% |
37 of 1,143 Imperial households received food stamps within the past year. |
Ingram |
1.2% |
20 of 1,606 Ingram households received food stamps within the past year. |
Jefferson Hills |
0.8% |
37 of 4,505 Jefferson Hills households received food stamps within the past year. |
Leetsdale |
3.6% |
20 of 561 Leetsdale households received food stamps within the past year. |
Liberty |
0.4% |
4 of 1,139 Liberty households received food stamps within the past year. |
Lincoln |
2.8% |
13 of 467 Lincoln households received food stamps within the past year. |
McKeesport |
3.0% |
268 of 8,913 McKeesport households received food stamps within the past year. |
McKees Rocks |
0.5% |
13 of 2,824 McKees Rocks households received food stamps within the past year. |
Millvale |
0.9% |
17 of 1,940 Millvale households received food stamps within the past year. |
Monroeville |
1.3% |
168 of 12,604 Monroeville households received food stamps within the past year. |
Mount Oliver |
4.6% |
58 of 1,250 Mount Oliver households received food stamps within the past year. |
Munhall |
1.5% |
76 of 5,097 Munhall households received food stamps within the past year. |
North Braddock |
4.0% |
90 of 2,237 North Braddock households received food stamps within the past year. |
Oakdale |
0.5% |
3 of 651 Oakdale households received food stamps within the past year. |
Oakmont |
2.0% |
61 of 3,093 Oakmont households received food stamps within the past year. |
Pitcairn |
5.4% |
81 of 1,498 Pitcairn households received food stamps within the past year. |
Pittsburgh |
1.7% |
2349 of 134,820 Pittsburgh households received food stamps within the past year. |
Pleasant Hills |
1.8% |
63 of 3,600 Pleasant Hills households received food stamps within the past year. |
Plum |
1.9% |
218 of 11,234 Plum households received food stamps within the past year. |
Port Vue |
1.7% |
31 of 1,856 Port Vue households received food stamps within the past year. |
Rankin |
9.4% |
89 of 943 Rankin households received food stamps within the past year. |
Russellton |
0.0% |
0 of 710 Russellton households received food stamps within the past year. |
Sewickley |
0.5% |
8 of 1,742 Sewickley households received food stamps within the past year. |
Sharpsburg |
1.4% |
22 of 1,561 Sharpsburg households received food stamps within the past year. |
South Park Township |
1.0% |
57 of 5,524 South Park Township households received food stamps within the past year. |
Springdale |
0.8% |
13 of 1,563 Springdale households received food stamps within the past year. |
Sturgeon |
1.8% |
10 of 565 Sturgeon households received food stamps within the past year. |
Swissvale |
4.6% |
203 of 4,411 Swissvale households received food stamps within the past year. |
Tarentum |
1.4% |
29 of 2,026 Tarentum households received food stamps within the past year. |
Turtle Creek |
3.6% |
88 of 2,442 Turtle Creek households received food stamps within the past year. |
Upper St. Clair |
0.6% |
44 of 7,143 Upper St. Clair households received food stamps within the past year. |
Verona |
0.6% |
8 of 1,242 Verona households received food stamps within the past year. |
Versailles |
1.2% |
10 of 812 Versailles households received food stamps within the past year. |
West Homestead |
0.7% |
6 of 818 West Homestead households received food stamps within the past year. |
West Mifflin |
2.0% |
176 of 8,712 West Mifflin households received food stamps within the past year. |
West View |
2.8% |
87 of 3,076 West View households received food stamps within the past year. |
Whitaker |
2.3% |
12 of 526 Whitaker households received food stamps within the past year. |
Whitehall |
2.0% |
119 of 5,840 Whitehall households received food stamps within the past year. |
White Oak |
1.3% |
47 of 3,670 White Oak households received food stamps within the past year. |
Wilkinsburg |
7.6% |
658 of 8,676 Wilkinsburg households received food stamps within the past year. |
Wilmerding |
3.5% |
33 of 937 Wilmerding households received food stamps within the past year. |