Idaho Food Stamps
How does Idaho rank for percentage of homes receiving food stamps?
Idaho ranks 33rd out of 50 states for lowest percentage of households receiving food stamps at 1.6%. The study is based on a total of 609,124 Idahoan households who reported whether or not food stamps were received.
How many Idaho households received food stamps in the past year?
9,798 households in Idaho received food stamps within the last year.
Idaho Food Stamps Received Map
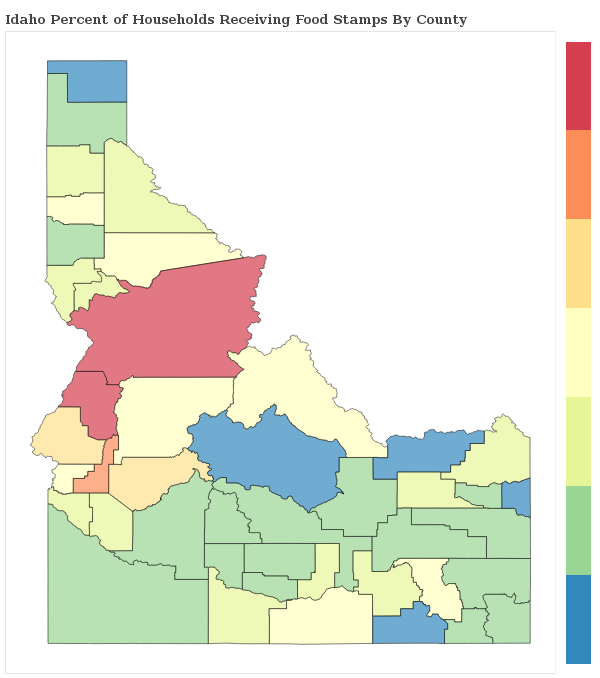
Idaho Food Stamps Received Map
Food Stamps Received By County
The percentage of households receiving food stamps in Idaho varies by county.
Applying For Idaho Food Stamp Programs
How do I apply for food stamps in Idaho?
There are 5 government food-related benefits that you may apply for as a resident of Idaho.
Want to explore more government assistance programs? Browse all government benefits available to Idaho residents.
Idaho Percentage of Households Receiving Food Stamps by City Statistics
How does the percentage of homes receiving food stamps compare across the largest cities in Idaho?
| City | Food Stamps | Details |
|---|---|---|
Boise City |
1.5% |
Boise City ranks 53rd of 90 among cities in Idaho based on a sample of 88,929 Idahoan households in Boise City. |
Caldwell |
1.3% |
Caldwell ranks 46th of 90 among cities in Idaho based on a sample of 16,204 Idahoan households in Caldwell. |
Coeur d'Alene |
2.8% |
Coeur d'Alene ranks 77th of 90 among cities in Idaho based on a sample of 20,090 Idahoan households in Coeur d'Alene. |
Idaho Falls |
1.1% |
Idaho Falls ranks 37th of 90 among cities in Idaho based on a sample of 21,724 Idahoan households in Idaho Falls. |
Lewiston |
1.7% |
Lewiston ranks 60th of 90 among cities in Idaho based on a sample of 13,527 Idahoan households in Lewiston. |
Meridian |
2.6% |
Meridian ranks 74th of 90 among cities in Idaho based on a sample of 33,201 Idahoan households in Meridian. |
Nampa |
1.3% |
Nampa ranks 47th of 90 among cities in Idaho based on a sample of 30,661 Idahoan households in Nampa. |
Pocatello |
2.1% |
Pocatello ranks 70th of 90 among cities in Idaho based on a sample of 20,549 Idahoan households in Pocatello. |
Post Falls |
1.3% |
Post Falls ranks 45th of 90 among cities in Idaho based on a sample of 11,875 Idahoan households in Post Falls. |
Twin Falls |
1.2% |
Twin Falls ranks 43rd of 90 among cities in Idaho based on a sample of 17,692 Idahoan households in Twin Falls. |
Research & Reports

Idaho Poverty Statistics
Which areas have the highest rate of poverty in Idaho? We breakdown the poverty rate by city and county across Idaho and rank communities with the highest and lowest concentrations of residents living below the poverty line.
Idaho Poverty Statistics
Social Security Payments in Idaho
How are the Social Security Payments distributed throughout Idaho? We breakdown social security benefits by city and county statewide and rank communities with the most and least social security income per capita.
Idaho Social Security
Food Stamps in America
Which areas receive the most food stamp public assistance in your state? We breakdown over 3,000 counties nationwide and rank communities with the most and least food and nutrional supplements given to residents.
See Food Stamp Statistics2018 Idaho Poverty Line
| Household Size | Poverty Level |
|---|---|
| 1 | $12,140 |
| 2 | $16,460 |
| 3 | $20,780 |
| 4 | $25,100 |
| 5 | $29,420 |
| 6 | $33,740 |
| Per Additional | +$4,320 |
The poverty line for Idaho in 2018 is based on the federal guidelines, which begins at $12,140 for a single person, adding $4,320 for each additional person.
Poverty In America
