Illinois Food Stamps
How does Illinois rank for percentage of homes receiving food stamps?
Illinois ranks 27th out of 50 states for lowest percentage of households receiving food stamps at 1.5%. The study is based on a total of 4,818,452 Illinoisan households who reported whether or not food stamps were received.
How many Illinois households received food stamps in the past year?
74,334 households in Illinois received food stamps within the last year.
Illinois Food Stamps Received Map

Illinois Food Stamps Received Map
Food Stamps Received By County
The percentage of households receiving food stamps in Illinois varies by county.
Applying For Illinois Food Stamp Programs
How do I apply for food stamps in Illinois?
There are 5 government food-related benefits that you may apply for as a resident of Illinois.
Want to explore more government assistance programs? Browse all government benefits available to Illinois residents.
Illinois Percentage of Households Receiving Food Stamps by City Statistics
How does the percentage of homes receiving food stamps compare across the largest cities in Illinois?
| City | Food Stamps | Details |
|---|---|---|
Aurora |
1.3% |
Aurora ranks 358th of 711 among cities in Illinois based on a sample of 62,604 Illinoisan households in Aurora. |
Champaign |
0.9% |
Champaign ranks 206th of 711 among cities in Illinois based on a sample of 33,834 Illinoisan households in Champaign. |
Chicago |
1.7% |
Chicago ranks 451st of 711 among cities in Illinois based on a sample of 1,046,789 Illinoisan households in Chicago. |
Elgin |
1.7% |
Elgin ranks 460th of 711 among cities in Illinois based on a sample of 35,919 Illinoisan households in Elgin. |
Joliet |
2.0% |
Joliet ranks 533rd of 711 among cities in Illinois based on a sample of 47,612 Illinoisan households in Joliet. |
Naperville |
1.2% |
Naperville ranks 303rd of 711 among cities in Illinois based on a sample of 51,272 Illinoisan households in Naperville. |
Peoria |
1.8% |
Peoria ranks 480th of 711 among cities in Illinois based on a sample of 46,491 Illinoisan households in Peoria. |
Rockford |
1.3% |
Rockford ranks 360th of 711 among cities in Illinois based on a sample of 58,939 Illinoisan households in Rockford. |
Springfield |
2.8% |
Springfield ranks 633rd of 711 among cities in Illinois based on a sample of 50,693 Illinoisan households in Springfield. |
Waukegan |
1.5% |
Waukegan ranks 420th of 711 among cities in Illinois based on a sample of 29,179 Illinoisan households in Waukegan. |
Research & Reports
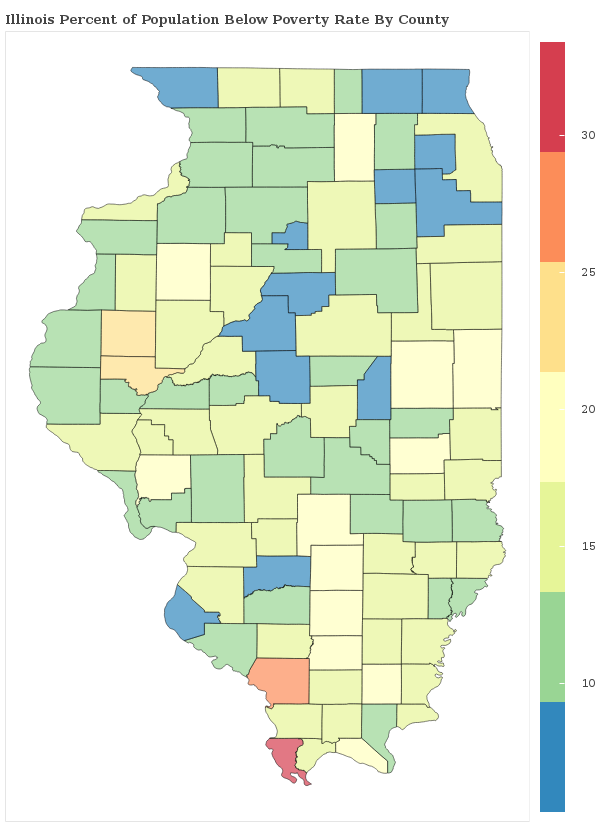
Illinois Poverty Statistics
Which areas have the highest rate of poverty in Illinois? We breakdown the poverty rate by city and county across Illinois and rank communities with the highest and lowest concentrations of residents living below the poverty line.
Illinois Poverty Statistics
Social Security Payments in Illinois
How are the Social Security Payments distributed throughout Illinois? We breakdown social security benefits by city and county statewide and rank communities with the most and least social security income per capita.
Illinois Social Security
Food Stamps in America
Which areas receive the most food stamp public assistance in your state? We breakdown over 3,000 counties nationwide and rank communities with the most and least food and nutrional supplements given to residents.
See Food Stamp Statistics2018 Illinois Poverty Line
| Household Size | Poverty Level |
|---|---|
| 1 | $12,140 |
| 2 | $16,460 |
| 3 | $20,780 |
| 4 | $25,100 |
| 5 | $29,420 |
| 6 | $33,740 |
| Per Additional | +$4,320 |
The poverty line for Illinois in 2018 is based on the federal guidelines, which begins at $12,140 for a single person, adding $4,320 for each additional person.
Poverty In America
