Massachusetts Food Stamps
How does Massachusetts rank for percentage of homes receiving food stamps?
Massachusetts ranks 36th out of 50 states for lowest percentage of households receiving food stamps at 1.7%. The study is based on a total of 2,585,715 Massachusettsan households who reported whether or not food stamps were received.
How many Massachusetts households received food stamps in the past year?
43,609 households in Massachusetts received food stamps within the last year.
Massachusetts Food Stamps Received Map

Massachusetts Food Stamps Received Map
Food Stamps Received By County
The percentage of households receiving food stamps in Massachusetts varies by county.
Applying For Massachusetts Food Stamp Programs
How do I apply for food stamps in Massachusetts?
There are 5 government food-related benefits that you may apply for as a resident of Massachusetts.
Want to explore more government assistance programs? Browse all government benefits available to Massachusetts residents.
Massachusetts Percentage of Households Receiving Food Stamps by City Statistics
How does the percentage of homes receiving food stamps compare across the largest cities in Massachusetts?
| City | Food Stamps | Details |
|---|---|---|
Boston |
2.4% |
Boston ranks 180th of 224 among cities in Massachusetts based on a sample of 263,229 Massachusettsan households in Boston. |
Brockton |
2.5% |
Brockton ranks 185th of 224 among cities in Massachusetts based on a sample of 32,200 Massachusettsan households in Brockton. |
Cambridge |
1.9% |
Cambridge ranks 156th of 224 among cities in Massachusetts based on a sample of 44,234 Massachusettsan households in Cambridge. |
Fall River |
1.7% |
Fall River ranks 144th of 224 among cities in Massachusetts based on a sample of 38,611 Massachusettsan households in Fall River. |
Lowell |
1.6% |
Lowell ranks 137th of 224 among cities in Massachusetts based on a sample of 38,965 Massachusettsan households in Lowell. |
Lynn |
1.3% |
Lynn ranks 106th of 224 among cities in Massachusetts based on a sample of 32,981 Massachusettsan households in Lynn. |
New Bedford |
2.8% |
New Bedford ranks 200th of 224 among cities in Massachusetts based on a sample of 39,491 Massachusettsan households in New Bedford. |
Quincy |
1.8% |
Quincy ranks 148th of 224 among cities in Massachusetts based on a sample of 40,167 Massachusettsan households in Quincy. |
Springfield |
2.6% |
Springfield ranks 197th of 224 among cities in Massachusetts based on a sample of 56,331 Massachusettsan households in Springfield. |
Worcester |
2.0% |
Worcester ranks 160th of 224 among cities in Massachusetts based on a sample of 70,792 Massachusettsan households in Worcester. |
Research & Reports
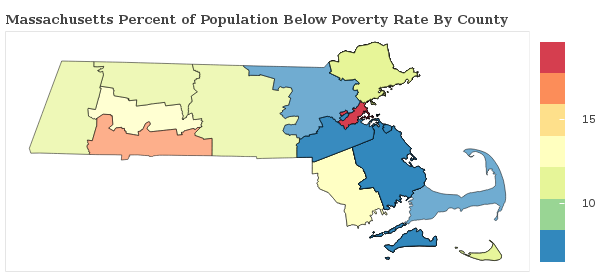
Massachusetts Poverty Statistics
Which areas have the highest rate of poverty in Massachusetts? We breakdown the poverty rate by city and county across Massachusetts and rank communities with the highest and lowest concentrations of residents living below the poverty line.
Massachusetts Poverty Statistics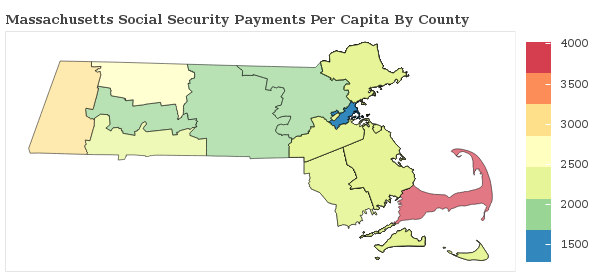
Massachusetts Social Security
Massachusetts Social Security Statistics
Massachusetts Social SecuritySocial Security Payments in Massachusetts
How are the Social Security Payments distributed throughout Massachusetts? We breakdown social security benefits by city and county statewide and rank communities with the most and least social security income per capita.
Massachusetts Social Security
Food Stamps in America
Which areas receive the most food stamp public assistance in your state? We breakdown over 3,000 counties nationwide and rank communities with the most and least food and nutrional supplements given to residents.
See Food Stamp Statistics2018 Massachusetts Poverty Line
| Household Size | Poverty Level |
|---|---|
| 1 | $12,140 |
| 2 | $16,460 |
| 3 | $20,780 |
| 4 | $25,100 |
| 5 | $29,420 |
| 6 | $33,740 |
| Per Additional | +$4,320 |
The poverty line for Massachusetts in 2018 is based on the federal guidelines, which begins at $12,140 for a single person, adding $4,320 for each additional person.
Poverty In America
