Minnesota Food Stamps
How does Minnesota rank for percentage of homes receiving food stamps?
Minnesota ranks 26th out of 50 states for lowest percentage of households receiving food stamps at 1.5%. The study is based on a total of 2,153,202 Minnesotan households who reported whether or not food stamps were received.
How many Minnesota households received food stamps in the past year?
33,181 households in Minnesota received food stamps within the last year.
Minnesota Food Stamps Received Map
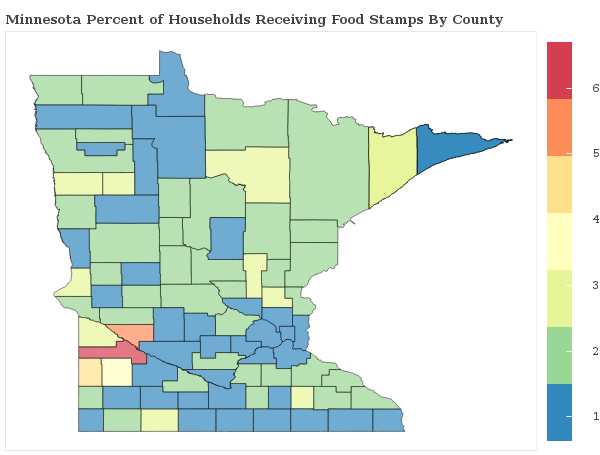
Minnesota Food Stamps Received Map
Food Stamps Received By County
The percentage of households receiving food stamps in Minnesota varies by county.
Applying For Minnesota Food Stamp Programs
How do I apply for food stamps in Minnesota?
There are 6 government food-related benefits that you may apply for as a resident of Minnesota.
Want to explore more government assistance programs? Browse all government benefits available to Minnesota residents.
Minnesota Percentage of Households Receiving Food Stamps by City Statistics
How does the percentage of homes receiving food stamps compare across the largest cities in Minnesota?
| City | Food Stamps | Details |
|---|---|---|
Bloomington |
1.1% |
Bloomington ranks 150th of 361 among cities in Minnesota based on a sample of 36,229 Minnesotan households in Bloomington. |
Brooklyn Park |
1.7% |
Brooklyn Park ranks 231st of 361 among cities in Minnesota based on a sample of 26,928 Minnesotan households in Brooklyn Park. |
Duluth |
2.2% |
Duluth ranks 284th of 361 among cities in Minnesota based on a sample of 36,003 Minnesotan households in Duluth. |
Maple Grove |
1.9% |
Maple Grove ranks 258th of 361 among cities in Minnesota based on a sample of 26,283 Minnesotan households in Maple Grove. |
Minneapolis |
1.4% |
Minneapolis ranks 189th of 361 among cities in Minnesota based on a sample of 172,082 Minnesotan households in Minneapolis. |
Plymouth |
0.8% |
Plymouth ranks 97th of 361 among cities in Minnesota based on a sample of 30,876 Minnesotan households in Plymouth. |
Rochester |
1.8% |
Rochester ranks 245th of 361 among cities in Minnesota based on a sample of 45,056 Minnesotan households in Rochester. |
St. Cloud |
2.0% |
St. Cloud ranks 266th of 361 among cities in Minnesota based on a sample of 25,847 Minnesotan households in St. Cloud. |
St. Paul |
1.5% |
St. Paul ranks 203rd of 361 among cities in Minnesota based on a sample of 112,502 Minnesotan households in St. Paul. |
Woodbury |
1.7% |
Woodbury ranks 225th of 361 among cities in Minnesota based on a sample of 24,443 Minnesotan households in Woodbury. |
Research & Reports
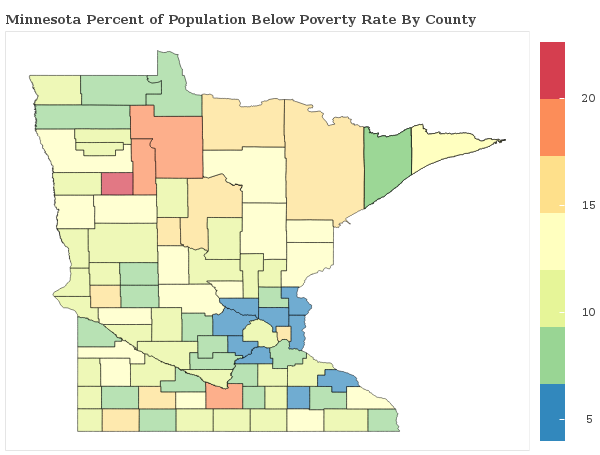
Minnesota Poverty Statistics
Which areas have the highest rate of poverty in Minnesota? We breakdown the poverty rate by city and county across Minnesota and rank communities with the highest and lowest concentrations of residents living below the poverty line.
Minnesota Poverty Statistics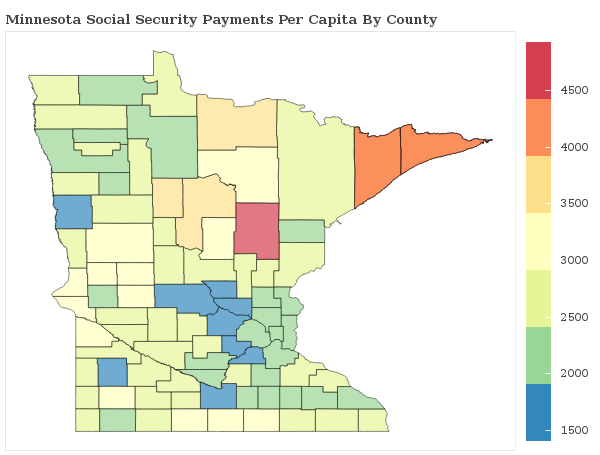
Social Security Payments in Minnesota
How are the Social Security Payments distributed throughout Minnesota? We breakdown social security benefits by city and county statewide and rank communities with the most and least social security income per capita.
Minnesota Social Security
Food Stamps in America
Which areas receive the most food stamp public assistance in your state? We breakdown over 3,000 counties nationwide and rank communities with the most and least food and nutrional supplements given to residents.
See Food Stamp Statistics2018 Minnesota Poverty Line
| Household Size | Poverty Level |
|---|---|
| 1 | $12,140 |
| 2 | $16,460 |
| 3 | $20,780 |
| 4 | $25,100 |
| 5 | $29,420 |
| 6 | $33,740 |
| Per Additional | +$4,320 |
The poverty line for Minnesota in 2018 is based on the federal guidelines, which begins at $12,140 for a single person, adding $4,320 for each additional person.
Poverty In America
