0.8% of Households Receive Food Stamps in Plymouth, Minnesota
Food Stamps in Plymouth, Minnesota
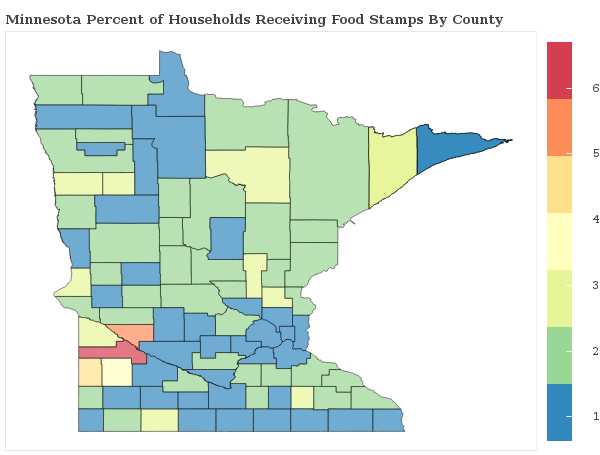
What percent of Households Receive Food Stamps in Plymouth?
The percentage of households receiving food stamps in the last year in Plymouth is 0.8%.
How Many Households in Plymouth Receive Food Stamps?
There are 243 households out of 30876 in Plymouth receiving food stamps.
Where does Plymouth Rank in Comparison to Other Minnesota Cities for HouseHolds Receiving Food Stamps?
Plymouth ranks 97th out of 361 cities and towns in Minnesota for the least number of households receiving food stamps. A smaller numeric rank indicates a lower percentage of homes receive food stamps.
How do other cities in Hennepin County compare to Plymouth when it comes to the percentage of homes receiving Food Stamps?
Cities must have a minimum of 1,000 residents to qualify
| City | Food Stamps | Details |
|---|---|---|
Bloomington |
1.1% |
405 of 36,229 Bloomington households received food stamps within the past year. |
Brooklyn Center |
2.6% |
272 of 10,663 Brooklyn Center households received food stamps within the past year. |
Brooklyn Park |
1.7% |
466 of 26,928 Brooklyn Park households received food stamps within the past year. |
Champlin |
0.7% |
58 of 8,736 Champlin households received food stamps within the past year. |
Corcoran |
1.7% |
34 of 1,979 Corcoran households received food stamps within the past year. |
Crystal |
1.3% |
120 of 9,287 Crystal households received food stamps within the past year. |
Deephaven |
1.9% |
26 of 1,377 Deephaven households received food stamps within the past year. |
Eden Prairie |
1.1% |
277 of 25,101 Eden Prairie households received food stamps within the past year. |
Edina |
1.7% |
370 of 21,454 Edina households received food stamps within the past year. |
Excelsior |
1.6% |
19 of 1,208 Excelsior households received food stamps within the past year. |
Golden Valley |
0.5% |
47 of 9,122 Golden Valley households received food stamps within the past year. |
Greenfield |
1.7% |
17 of 1,007 Greenfield households received food stamps within the past year. |
Hopkins |
2.5% |
205 of 8,285 Hopkins households received food stamps within the past year. |
Independence |
1.6% |
20 of 1,254 Independence households received food stamps within the past year. |
Long Lake |
0.8% |
6 of 728 Long Lake households received food stamps within the past year. |
Maple Grove |
1.9% |
511 of 26,283 Maple Grove households received food stamps within the past year. |
Maple Plain |
0.0% |
0 of 716 Maple Plain households received food stamps within the past year. |
Medina |
0.3% |
7 of 2,030 Medina households received food stamps within the past year. |
Minneapolis |
1.4% |
2412 of 172,082 Minneapolis households received food stamps within the past year. |
Minnetonka |
1.4% |
313 of 23,044 Minnetonka households received food stamps within the past year. |
Minnetrista |
3.8% |
91 of 2,420 Minnetrista households received food stamps within the past year. |
Mound |
1.4% |
59 of 4,176 Mound households received food stamps within the past year. |
New Hope |
1.8% |
152 of 8,341 New Hope households received food stamps within the past year. |
Orono |
0.5% |
16 of 3,032 Orono households received food stamps within the past year. |
Osseo |
3.4% |
41 of 1,212 Osseo households received food stamps within the past year. |
Plymouth |
0.8% |
243 of 30,876 Plymouth households received food stamps within the past year. |
Richfield |
1.1% |
169 of 14,976 Richfield households received food stamps within the past year. |
Robbinsdale |
1.4% |
86 of 6,245 Robbinsdale households received food stamps within the past year. |
Rogers |
1.4% |
56 of 4,118 Rogers households received food stamps within the past year. |
St. Bonifacius |
2.3% |
21 of 910 St. Bonifacius households received food stamps within the past year. |
St. Louis Park |
0.8% |
194 of 22,998 St. Louis Park households received food stamps within the past year. |
Shorewood |
0.9% |
26 of 2,847 Shorewood households received food stamps within the past year. |
Spring Park |
1.0% |
10 of 1,005 Spring Park households received food stamps within the past year. |
Tonka Bay |
0.9% |
5 of 557 Tonka Bay households received food stamps within the past year. |
Wayzata |
1.0% |
21 of 2,202 Wayzata households received food stamps within the past year. |