Virginia Food Stamps
How does Virginia rank for percentage of homes receiving food stamps?
Virginia ranks 39th out of 50 states for lowest percentage of households receiving food stamps at 1.7%. The study is based on a total of 3,105,636 Virginian households who reported whether or not food stamps were received.
How many Virginia households received food stamps in the past year?
53,095 households in Virginia received food stamps within the last year.
Virginia Food Stamps Received Map
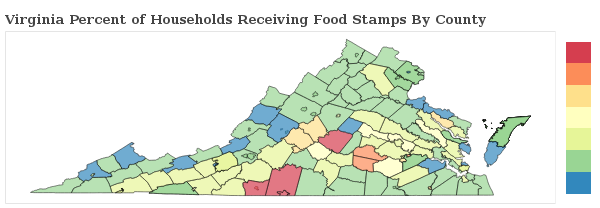
Virginia Food Stamps Received Map
Food Stamps Received By County
The percentage of households receiving food stamps in Virginia varies by county.
Applying For Virginia Food Stamp Programs
How do I apply for food stamps in Virginia?
There are 5 government food-related benefits that you may apply for as a resident of Virginia.
Want to explore more government assistance programs? Browse all government benefits available to Virginia residents.
Virginia Percentage of Households Receiving Food Stamps by City Statistics
How does the percentage of homes receiving food stamps compare across the largest cities in Virginia?
| City | Food Stamps | Details |
|---|---|---|
Alexandria |
1.2% |
Alexandria ranks 182nd of 362 among cities in Virginia based on a sample of 68,663 Virginian households in Alexandria. |
Arlington |
1.1% |
Arlington ranks 152nd of 362 among cities in Virginia based on a sample of 102,310 Virginian households in Arlington. |
Chesapeake |
1.4% |
Chesapeake ranks 212th of 362 among cities in Virginia based on a sample of 83,031 Virginian households in Chesapeake. |
Hampton |
2.0% |
Hampton ranks 259th of 362 among cities in Virginia based on a sample of 53,555 Virginian households in Hampton. |
Newport News |
1.6% |
Newport News ranks 232nd of 362 among cities in Virginia based on a sample of 68,665 Virginian households in Newport News. |
Norfolk |
1.3% |
Norfolk ranks 183rd of 362 among cities in Virginia based on a sample of 87,249 Virginian households in Norfolk. |
Portsmouth |
2.0% |
Portsmouth ranks 262nd of 362 among cities in Virginia based on a sample of 36,616 Virginian households in Portsmouth. |
Richmond |
2.4% |
Richmond ranks 286th of 362 among cities in Virginia based on a sample of 89,238 Virginian households in Richmond. |
Roanoke |
1.5% |
Roanoke ranks 220th of 362 among cities in Virginia based on a sample of 42,333 Virginian households in Roanoke. |
Virginia Beach |
1.3% |
Virginia Beach ranks 190th of 362 among cities in Virginia based on a sample of 167,731 Virginian households in Virginia Beach. |
Research & Reports
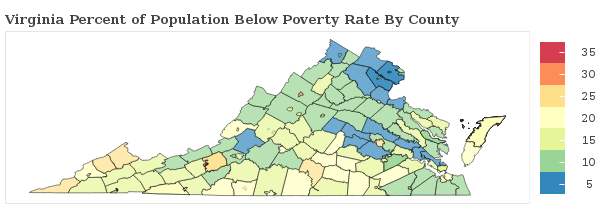
Virginia Poverty Statistics
Which areas have the highest rate of poverty in Virginia? We breakdown the poverty rate by city and county across Virginia and rank communities with the highest and lowest concentrations of residents living below the poverty line.
Virginia Poverty Statistics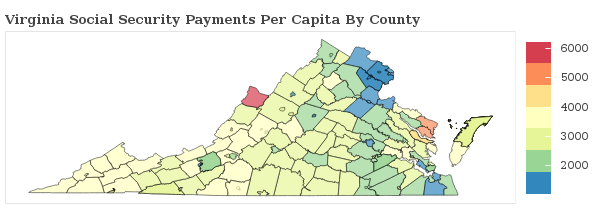
Social Security Payments in Virginia
How are the Social Security Payments distributed throughout Virginia? We breakdown social security benefits by city and county statewide and rank communities with the most and least social security income per capita.
Virginia Social Security
Food Stamps in America
Which areas receive the most food stamp public assistance in your state? We breakdown over 3,000 counties nationwide and rank communities with the most and least food and nutrional supplements given to residents.
See Food Stamp Statistics2018 Virginia Poverty Line
| Household Size | Poverty Level |
|---|---|
| 1 | $12,140 |
| 2 | $16,460 |
| 3 | $20,780 |
| 4 | $25,100 |
| 5 | $29,420 |
| 6 | $33,740 |
| Per Additional | +$4,320 |
The poverty line for Virginia in 2018 is based on the federal guidelines, which begins at $12,140 for a single person, adding $4,320 for each additional person.
Poverty In America
