South Carolina Food Stamps
How does South Carolina rank for percentage of homes receiving food stamps?
South Carolina ranks 45th out of 50 states for lowest percentage of households receiving food stamps at 2.1%. The study is based on a total of 1,871,307 South Carolinian households who reported whether or not food stamps were received.
How many South Carolina households received food stamps in the past year?
38,937 households in South Carolina received food stamps within the last year.
South Carolina Food Stamps Received Map
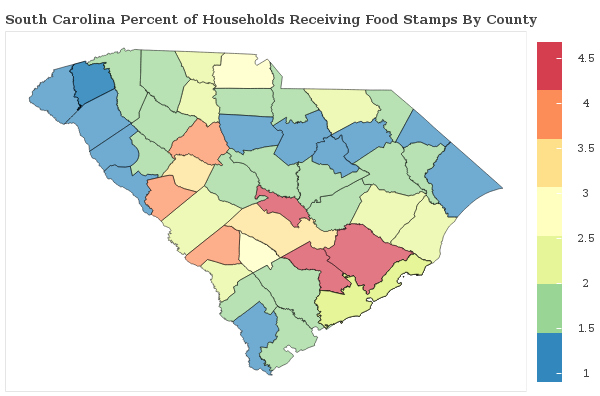
South Carolina Food Stamps Received Map
Food Stamps Received By County
The percentage of households receiving food stamps in South Carolina varies by county.
Applying For South Carolina Food Stamp Programs
How do I apply for food stamps in South Carolina?
There are 5 government food-related benefits that you may apply for as a resident of South Carolina.
Want to explore more government assistance programs? Browse all government benefits available to South Carolina residents.
South Carolina Percentage of Households Receiving Food Stamps by City Statistics
How does the percentage of homes receiving food stamps compare across the largest cities in South Carolina?
| City | Food Stamps | Details |
|---|---|---|
Charleston |
2.4% |
Charleston ranks 150th of 236 among cities in South Carolina based on a sample of 53,845 South Carolinian households in Charleston. |
Columbia |
2.2% |
Columbia ranks 140th of 236 among cities in South Carolina based on a sample of 46,098 South Carolinian households in Columbia. |
Goose Creek |
3.7% |
Goose Creek ranks 196th of 236 among cities in South Carolina based on a sample of 13,756 South Carolinian households in Goose Creek. |
Greenville |
1.5% |
Greenville ranks 99th of 236 among cities in South Carolina based on a sample of 28,013 South Carolinian households in Greenville. |
Hilton Head Island |
1.6% |
Hilton Head Island ranks 108th of 236 among cities in South Carolina based on a sample of 16,868 South Carolinian households in Hilton Head Island. |
Mount Pleasant |
0.7% |
Mount Pleasant ranks 40th of 236 among cities in South Carolina based on a sample of 32,063 South Carolinian households in Mount Pleasant. |
North Charleston |
2.6% |
North Charleston ranks 163rd of 236 among cities in South Carolina based on a sample of 40,577 South Carolinian households in North Charleston. |
Rock Hill |
3.8% |
Rock Hill ranks 198th of 236 among cities in South Carolina based on a sample of 27,807 South Carolinian households in Rock Hill. |
Summerville |
4.0% |
Summerville ranks 203rd of 236 among cities in South Carolina based on a sample of 17,565 South Carolinian households in Summerville. |
Sumter |
1.7% |
Sumter ranks 118th of 236 among cities in South Carolina based on a sample of 16,238 South Carolinian households in Sumter. |
Research & Reports
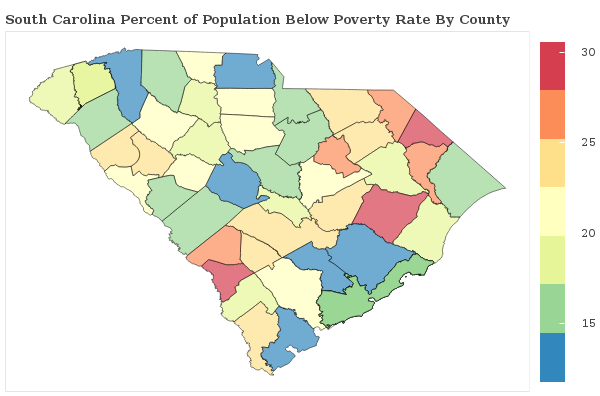
South Carolina Poverty Statistics
Which areas have the highest rate of poverty in South Carolina? We breakdown the poverty rate by city and county across South Carolina and rank communities with the highest and lowest concentrations of residents living below the poverty line.
South Carolina Poverty Statistics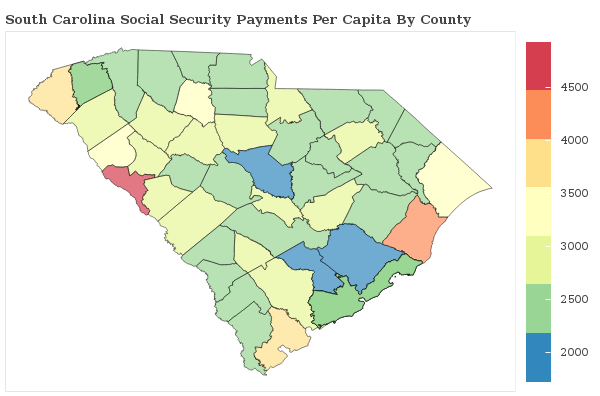
South Carolina Social Security
South Carolina Social Security Statistics
South Carolina Social SecuritySocial Security Payments in South Carolina
How are the Social Security Payments distributed throughout South Carolina? We breakdown social security benefits by city and county statewide and rank communities with the most and least social security income per capita.
South Carolina Social Security
Food Stamps in America
Which areas receive the most food stamp public assistance in your state? We breakdown over 3,000 counties nationwide and rank communities with the most and least food and nutrional supplements given to residents.
See Food Stamp Statistics2018 South Carolina Poverty Line
| Household Size | Poverty Level |
|---|---|
| 1 | $12,140 |
| 2 | $16,460 |
| 3 | $20,780 |
| 4 | $25,100 |
| 5 | $29,420 |
| 6 | $33,740 |
| Per Additional | +$4,320 |
The poverty line for South Carolina in 2018 is based on the federal guidelines, which begins at $12,140 for a single person, adding $4,320 for each additional person.
Poverty In America
