Connecticut Food Stamps
How does Connecticut rank for percentage of homes receiving food stamps?
Connecticut ranks 20th out of 50 states for lowest percentage of households receiving food stamps at 1.4%. The study is based on a total of 1,361,755 Connecticuter households who reported whether or not food stamps were received.
How many Connecticut households received food stamps in the past year?
19,660 households in Connecticut received food stamps within the last year.
Connecticut Food Stamps Received Map
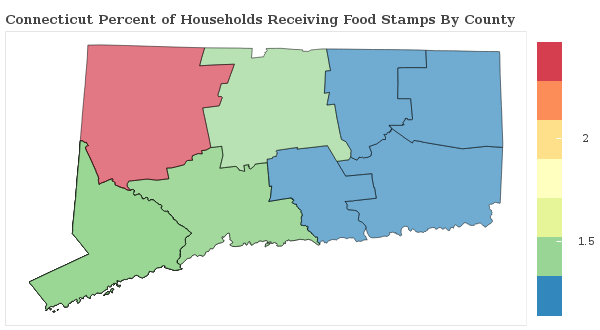
Connecticut Food Stamps Received Map
Food Stamps Received By County
The percentage of households receiving food stamps in Connecticut varies by county.
Applying For Connecticut Food Stamp Programs
How do I apply for food stamps in Connecticut?
There are 5 government food-related benefits that you may apply for as a resident of Connecticut.
Want to explore more government assistance programs? Browse all government benefits available to Connecticut residents.
Connecticut Percentage of Households Receiving Food Stamps by City Statistics
How does the percentage of homes receiving food stamps compare across the largest cities in Connecticut?
| City | Food Stamps | Details |
|---|---|---|
Bridgeport |
2.5% |
Bridgeport ranks 108th of 128 among cities in Connecticut based on a sample of 50,341 Connecticuter households in Bridgeport. |
Bristol |
1.8% |
Bristol ranks 94th of 128 among cities in Connecticut based on a sample of 24,789 Connecticuter households in Bristol. |
Danbury |
1.4% |
Danbury ranks 75th of 128 among cities in Connecticut based on a sample of 29,692 Connecticuter households in Danbury. |
Hartford |
1.7% |
Hartford ranks 92nd of 128 among cities in Connecticut based on a sample of 45,822 Connecticuter households in Hartford. |
New Britain |
0.9% |
New Britain ranks 51st of 128 among cities in Connecticut based on a sample of 28,531 Connecticuter households in New Britain. |
New Haven |
1.1% |
New Haven ranks 58th of 128 among cities in Connecticut based on a sample of 49,987 Connecticuter households in New Haven. |
Norwalk |
1.4% |
Norwalk ranks 76th of 128 among cities in Connecticut based on a sample of 33,385 Connecticuter households in Norwalk. |
Stamford |
1.0% |
Stamford ranks 56th of 128 among cities in Connecticut based on a sample of 48,647 Connecticuter households in Stamford. |
Waterbury |
2.4% |
Waterbury ranks 105th of 128 among cities in Connecticut based on a sample of 39,816 Connecticuter households in Waterbury. |
West Hartford |
1.3% |
West Hartford ranks 74th of 128 among cities in Connecticut based on a sample of 24,470 Connecticuter households in West Hartford. |
Research & Reports
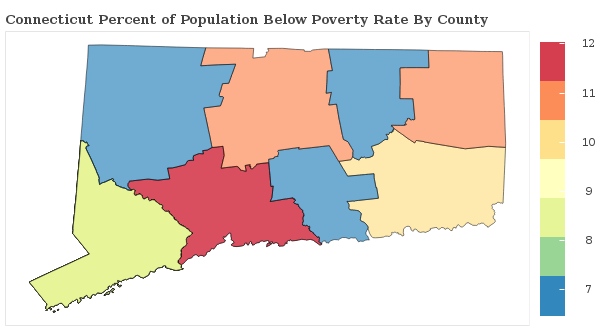
Connecticut Poverty Statistics
Which areas have the highest rate of poverty in Connecticut? We breakdown the poverty rate by city and county across Connecticut and rank communities with the highest and lowest concentrations of residents living below the poverty line.
Connecticut Poverty Statistics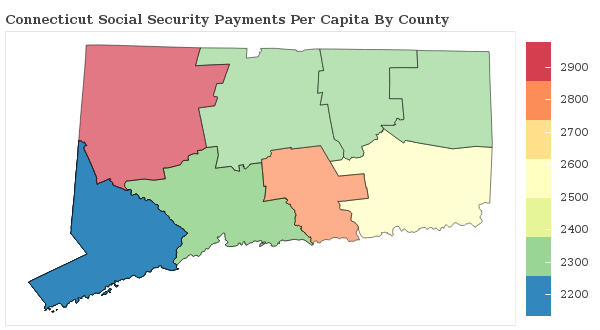
Social Security Payments in Connecticut
How are the Social Security Payments distributed throughout Connecticut? We breakdown social security benefits by city and county statewide and rank communities with the most and least social security income per capita.
Connecticut Social Security
Food Stamps in America
Which areas receive the most food stamp public assistance in your state? We breakdown over 3,000 counties nationwide and rank communities with the most and least food and nutrional supplements given to residents.
See Food Stamp Statistics2018 Connecticut Poverty Line
| Household Size | Poverty Level |
|---|---|
| 1 | $12,140 |
| 2 | $16,460 |
| 3 | $20,780 |
| 4 | $25,100 |
| 5 | $29,420 |
| 6 | $33,740 |
| Per Additional | +$4,320 |
The poverty line for Connecticut in 2018 is based on the federal guidelines, which begins at $12,140 for a single person, adding $4,320 for each additional person.
Poverty In America
