1.3% of Households Receive Food Stamps in West Hartford, Connecticut
Food Stamps in West Hartford, Connecticut
What percent of Households Receive Food Stamps in West Hartford?
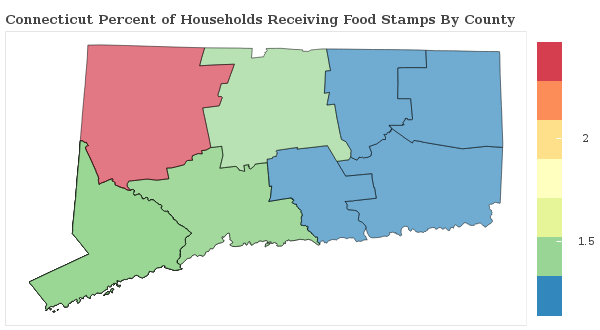
The percentage of households receiving food stamps in the last year in West Hartford is 1.3%.
How Many Households in West Hartford Receive Food Stamps?
There are 330 households out of 24470 in West Hartford receiving food stamps.
Where does West Hartford Rank in Comparison to Other Connecticut Cities for HouseHolds Receiving Food Stamps?
West Hartford ranks 74th out of 128 cities and towns in Connecticut for the least number of households receiving food stamps. A smaller numeric rank indicates a lower percentage of homes receive food stamps.
How do other cities in Hartford County compare to West Hartford when it comes to the percentage of homes receiving Food Stamps?
Cities must have a minimum of 1,000 residents to qualify
| City | Food Stamps | Details |
|---|---|---|
Kensington |
0.9% |
33 of 3,544 Kensington households received food stamps within the past year. |
Manchester |
1.3% |
158 of 12,491 Manchester households received food stamps within the past year. |
New Britain |
0.9% |
261 of 28,531 New Britain households received food stamps within the past year. |
Newington |
1.0% |
121 of 12,519 Newington households received food stamps within the past year. |
North Granby |
0.0% |
0 of 503 North Granby households received food stamps within the past year. |
Salmon Brook |
0.9% |
10 of 1,071 Salmon Brook households received food stamps within the past year. |
Blue Hills |
7.4% |
82 of 1,109 Blue Hills households received food stamps within the past year. |
Bristol |
1.8% |
440 of 24,789 Bristol households received food stamps within the past year. |
Broad Brook |
0.0% |
0 of 1,706 Broad Brook households received food stamps within the past year. |
Canton Valley |
0.0% |
0 of 644 Canton Valley households received food stamps within the past year. |
Collinsville |
0.0% |
0 of 1,526 Collinsville households received food stamps within the past year. |
East Hartford |
2.0% |
393 of 19,572 East Hartford households received food stamps within the past year. |
Glastonbury Center |
1.5% |
51 of 3,353 Glastonbury Center households received food stamps within the past year. |
Hartford |
1.7% |
796 of 45,822 Hartford households received food stamps within the past year. |
Hazardville |
2.4% |
47 of 1,976 Hazardville households received food stamps within the past year. |
Sherwood Manor |
3.5% |
75 of 2,159 Sherwood Manor households received food stamps within the past year. |
Simsbury Center |
0.7% |
18 of 2,421 Simsbury Center households received food stamps within the past year. |
Southwood Acres |
0.3% |
9 of 3,019 Southwood Acres households received food stamps within the past year. |
Suffield Depot |
0.0% |
0 of 546 Suffield Depot households received food stamps within the past year. |
Tariffville |
0.0% |
0 of 556 Tariffville households received food stamps within the past year. |
Terramuggus |
4.2% |
17 of 407 Terramuggus households received food stamps within the past year. |
Thompsonville |
0.6% |
20 of 3,436 Thompsonville households received food stamps within the past year. |
Weatogue |
0.7% |
7 of 1,013 Weatogue households received food stamps within the past year. |
West Hartford |
1.3% |
330 of 24,470 West Hartford households received food stamps within the past year. |
West Simsbury |
5.5% |
46 of 830 West Simsbury households received food stamps within the past year. |
Wethersfield |
1.3% |
138 of 10,778 Wethersfield households received food stamps within the past year. |
Windsor Locks |
2.8% |
142 of 5,078 Windsor Locks households received food stamps within the past year. |
