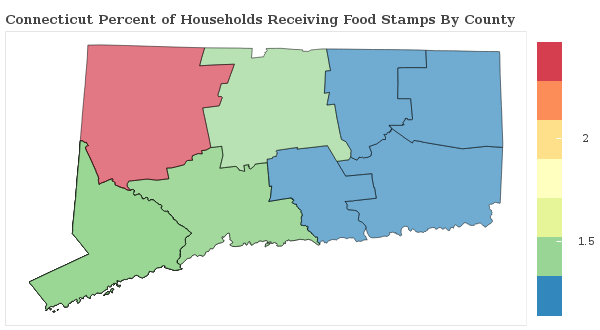
1.4% of Households Receive Food Stamps in Norwalk, Connecticut
Food Stamps in Norwalk, Connecticut
What percent of Households Receive Food Stamps in Norwalk?
The percentage of households receiving food stamps in the last year in Norwalk is 1.4%.
How Many Households in Norwalk Receive Food Stamps?
There are 454 households out of 33385 in Norwalk receiving food stamps.
Where does Norwalk Rank in Comparison to Other Connecticut Cities for HouseHolds Receiving Food Stamps?
Norwalk ranks 76th out of 128 cities and towns in Connecticut for the least number of households receiving food stamps. A smaller numeric rank indicates a lower percentage of homes receive food stamps.
How do other cities in Fairfield County compare to Norwalk when it comes to the percentage of homes receiving Food Stamps?
Cities must have a minimum of 1,000 residents to qualify
| City | Food Stamps | Details |
|---|---|---|
Newtown |
0.0% |
0 of 691 Newtown households received food stamps within the past year. |
Norwalk |
1.4% |
454 of 33,385 Norwalk households received food stamps within the past year. |
Old Greenwich |
0.8% |
17 of 2,190 Old Greenwich households received food stamps within the past year. |
Pemberwick |
0.0% |
0 of 1,397 Pemberwick households received food stamps within the past year. |
Ridgefield |
1.6% |
48 of 3,072 Ridgefield households received food stamps within the past year. |
Riverside |
2.1% |
57 of 2,741 Riverside households received food stamps within the past year. |
Bethel |
2.8% |
112 of 3,962 Bethel households received food stamps within the past year. |
Bridgeport |
2.5% |
1250 of 50,341 Bridgeport households received food stamps within the past year. |
Byram |
3.1% |
51 of 1,648 Byram households received food stamps within the past year. |
Cos Cob |
2.5% |
62 of 2,473 Cos Cob households received food stamps within the past year. |
Danbury |
1.4% |
403 of 29,692 Danbury households received food stamps within the past year. |
Darien |
1.1% |
71 of 6,703 Darien households received food stamps within the past year. |
Georgetown |
1.2% |
9 of 747 Georgetown households received food stamps within the past year. |
Glenville |
1.1% |
11 of 982 Glenville households received food stamps within the past year. |
Greenwich |
0.7% |
38 of 5,624 Greenwich households received food stamps within the past year. |
Shelton |
1.8% |
291 of 15,961 Shelton households received food stamps within the past year. |
Southport |
1.4% |
11 of 773 Southport households received food stamps within the past year. |
Stamford |
1.0% |
509 of 48,647 Stamford households received food stamps within the past year. |
Stratford |
1.5% |
310 of 20,179 Stratford households received food stamps within the past year. |
Trumbull |
1.7% |
216 of 12,383 Trumbull households received food stamps within the past year. |
Westport |
0.6% |
60 of 9,820 Westport households received food stamps within the past year. |
