Rhode Island Food Stamps
How does Rhode Island rank for percentage of homes receiving food stamps?
Rhode Island ranks 13th out of 50 states for lowest percentage of households receiving food stamps at 1.4%. The study is based on a total of 412,028 Rhode Islander households who reported whether or not food stamps were received.
How many Rhode Island households received food stamps in the past year?
5,726 households in Rhode Island received food stamps within the last year.
Rhode Island Food Stamps Received Map
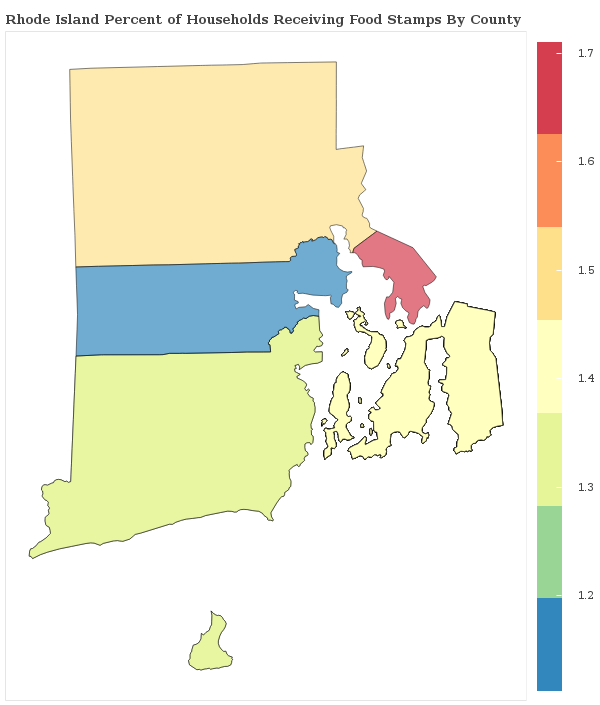
Rhode Island Food Stamps Received Map
Food Stamps Received By County
The percentage of households receiving food stamps in Rhode Island varies by county.
Applying For Rhode Island Food Stamp Programs
How do I apply for food stamps in Rhode Island?
There are 5 government food-related benefits that you may apply for as a resident of Rhode Island.
Want to explore more government assistance programs? Browse all government benefits available to Rhode Island residents.
Rhode Island Percentage of Households Receiving Food Stamps by City Statistics
How does the percentage of homes receiving food stamps compare across the largest cities in Rhode Island?
| City | Food Stamps | Details |
|---|---|---|
Central Falls |
1.3% |
Central Falls ranks 12th of 25 among cities in Rhode Island based on a sample of 6,310 Rhode Islander households in Central Falls. |
Cranston |
1.5% |
Cranston ranks 13th of 25 among cities in Rhode Island based on a sample of 30,515 Rhode Islander households in Cranston. |
East Providence |
1.9% |
East Providence ranks 19th of 25 among cities in Rhode Island based on a sample of 19,913 Rhode Islander households in East Providence. |
Newport |
1.2% |
Newport ranks 9th of 25 among cities in Rhode Island based on a sample of 10,523 Rhode Islander households in Newport. |
Pawtucket |
2.1% |
Pawtucket ranks 21st of 25 among cities in Rhode Island based on a sample of 27,635 Rhode Islander households in Pawtucket. |
Providence |
1.2% |
Providence ranks 10th of 25 among cities in Rhode Island based on a sample of 62,057 Rhode Islander households in Providence. |
Valley Falls |
0.6% |
Valley Falls ranks 6th of 25 among cities in Rhode Island based on a sample of 4,661 Rhode Islander households in Valley Falls. |
Warwick |
1.5% |
Warwick ranks 15th of 25 among cities in Rhode Island based on a sample of 34,904 Rhode Islander households in Warwick. |
Westerly |
0.9% |
Westerly ranks 7th of 25 among cities in Rhode Island based on a sample of 7,664 Rhode Islander households in Westerly. |
Woonsocket |
0.9% |
Woonsocket ranks 8th of 25 among cities in Rhode Island based on a sample of 17,054 Rhode Islander households in Woonsocket. |
Research & Reports
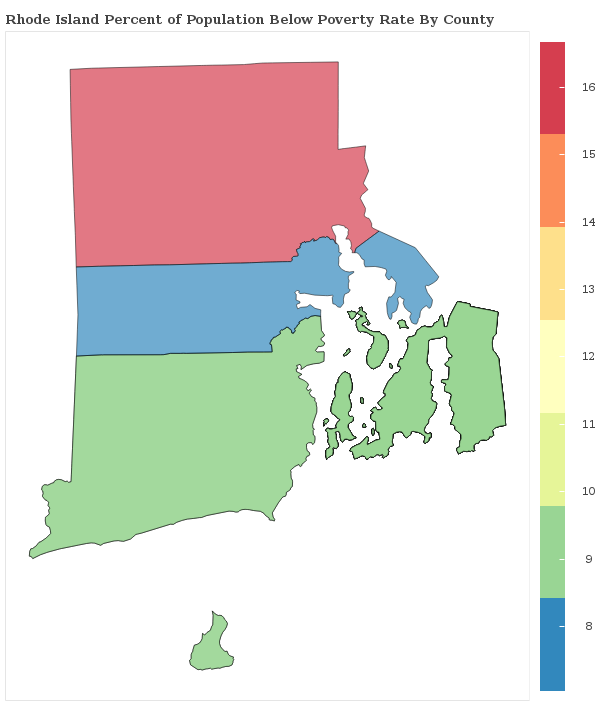
Rhode Island Poverty Statistics
Which areas have the highest rate of poverty in Rhode Island? We breakdown the poverty rate by city and county across Rhode Island and rank communities with the highest and lowest concentrations of residents living below the poverty line.
Rhode Island Poverty Statistics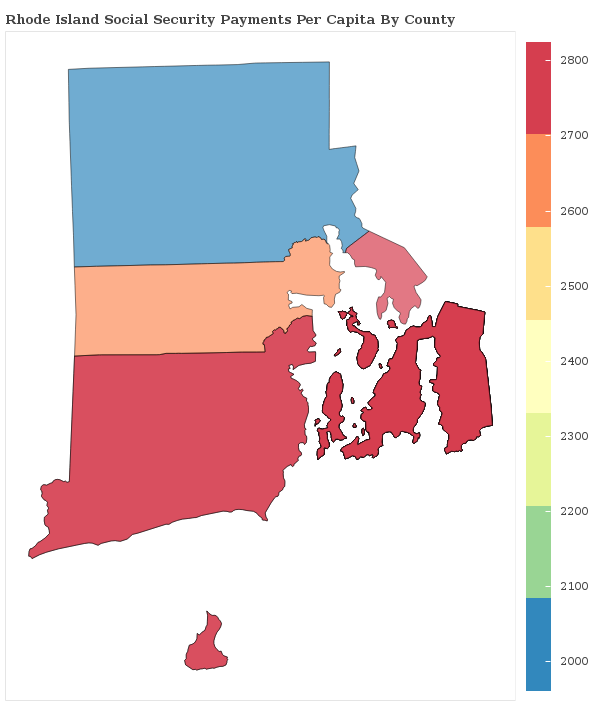
Social Security Payments in Rhode Island
How are the Social Security Payments distributed throughout Rhode Island? We breakdown social security benefits by city and county statewide and rank communities with the most and least social security income per capita.
Rhode Island Social Security
Food Stamps in America
Which areas receive the most food stamp public assistance in your state? We breakdown over 3,000 counties nationwide and rank communities with the most and least food and nutrional supplements given to residents.
See Food Stamp Statistics2018 Rhode Island Poverty Line
| Household Size | Poverty Level |
|---|---|
| 1 | $12,140 |
| 2 | $16,460 |
| 3 | $20,780 |
| 4 | $25,100 |
| 5 | $29,420 |
| 6 | $33,740 |
| Per Additional | +$4,320 |
The poverty line for Rhode Island in 2018 is based on the federal guidelines, which begins at $12,140 for a single person, adding $4,320 for each additional person.
Poverty In America
