Missouri Food Stamps
How does Missouri rank for percentage of homes receiving food stamps?
Missouri ranks 40th out of 50 states for lowest percentage of households receiving food stamps at 1.7%. The study is based on a total of 2,386,203 Missourian households who reported whether or not food stamps were received.
How many Missouri households received food stamps in the past year?
40,985 households in Missouri received food stamps within the last year.
Missouri Food Stamps Received Map
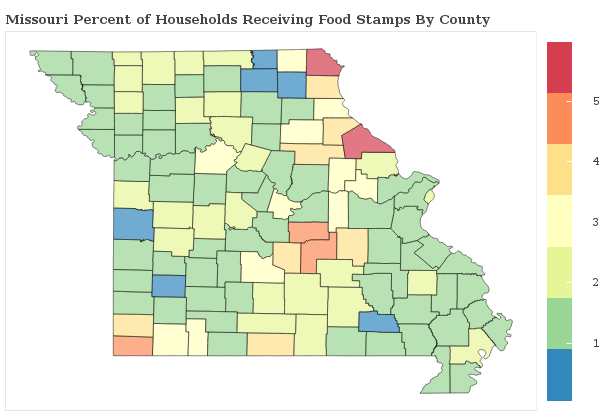
Missouri Food Stamps Received Map
Food Stamps Received By County
The percentage of households receiving food stamps in Missouri varies by county.
Applying For Missouri Food Stamp Programs
How do I apply for food stamps in Missouri?
There are 5 government food-related benefits that you may apply for as a resident of Missouri.
Want to explore more government assistance programs? Browse all government benefits available to Missouri residents.
Missouri Percentage of Households Receiving Food Stamps by City Statistics
How does the percentage of homes receiving food stamps compare across the largest cities in Missouri?
| City | Food Stamps | Details |
|---|---|---|
Columbia |
1.5% |
Columbia ranks 186th of 373 among cities in Missouri based on a sample of 47,000 Missourian households in Columbia. |
Independence |
1.9% |
Independence ranks 242nd of 373 among cities in Missouri based on a sample of 48,197 Missourian households in Independence. |
Kansas City |
1.6% |
Kansas City ranks 206th of 373 among cities in Missouri based on a sample of 198,935 Missourian households in Kansas City. |
Lee's Summit |
1.3% |
Lee's Summit ranks 162nd of 373 among cities in Missouri based on a sample of 35,286 Missourian households in Lee's Summit. |
O'Fallon |
1.5% |
O'Fallon ranks 191st of 373 among cities in Missouri based on a sample of 30,354 Missourian households in O'Fallon. |
Springfield |
1.5% |
Springfield ranks 196th of 373 among cities in Missouri based on a sample of 72,765 Missourian households in Springfield. |
St. Charles |
1.6% |
St. Charles ranks 213th of 373 among cities in Missouri based on a sample of 27,567 Missourian households in St. Charles. |
St. Joseph |
1.1% |
St. Joseph ranks 143rd of 373 among cities in Missouri based on a sample of 28,603 Missourian households in St. Joseph. |
St. Louis |
2.3% |
St. Louis ranks 275th of 373 among cities in Missouri based on a sample of 139,741 Missourian households in St. Louis. |
St. Peters |
1.4% |
St. Peters ranks 177th of 373 among cities in Missouri based on a sample of 22,200 Missourian households in St. Peters. |
Research & Reports
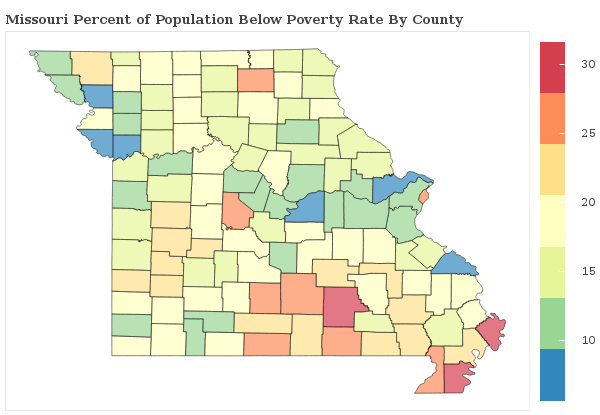
Missouri Poverty Statistics
Which areas have the highest rate of poverty in Missouri? We breakdown the poverty rate by city and county across Missouri and rank communities with the highest and lowest concentrations of residents living below the poverty line.
Missouri Poverty Statistics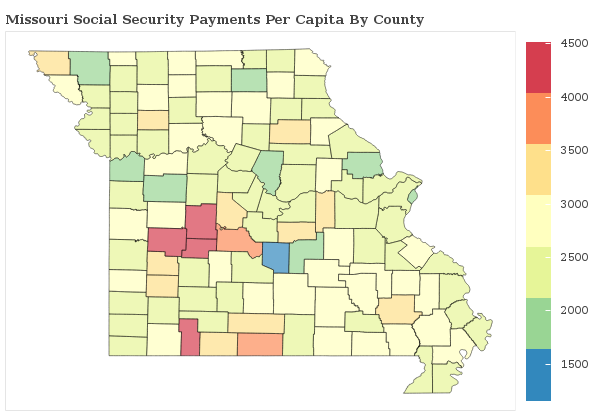
Social Security Payments in Missouri
How are the Social Security Payments distributed throughout Missouri? We breakdown social security benefits by city and county statewide and rank communities with the most and least social security income per capita.
Missouri Social Security
Food Stamps in America
Which areas receive the most food stamp public assistance in your state? We breakdown over 3,000 counties nationwide and rank communities with the most and least food and nutrional supplements given to residents.
See Food Stamp Statistics2018 Missouri Poverty Line
| Household Size | Poverty Level |
|---|---|
| 1 | $12,140 |
| 2 | $16,460 |
| 3 | $20,780 |
| 4 | $25,100 |
| 5 | $29,420 |
| 6 | $33,740 |
| Per Additional | +$4,320 |
The poverty line for Missouri in 2018 is based on the federal guidelines, which begins at $12,140 for a single person, adding $4,320 for each additional person.
Poverty In America
