Iowa Food Stamps
How does Iowa rank for percentage of homes receiving food stamps?
Iowa ranks 37th out of 50 states for lowest percentage of households receiving food stamps at 1.7%. The study is based on a total of 1,251,587 Iowan households who reported whether or not food stamps were received.
How many Iowa households received food stamps in the past year?
21,207 households in Iowa received food stamps within the last year.
Iowa Food Stamps Received Map
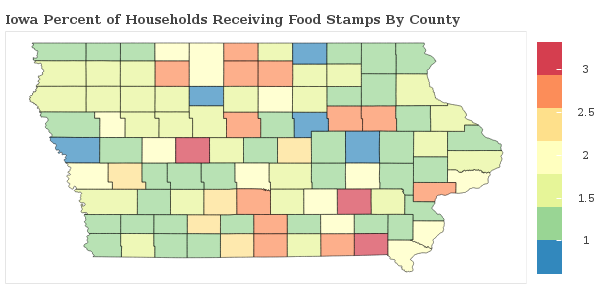
Iowa Food Stamps Received Map
Food Stamps Received By County
The percentage of households receiving food stamps in Iowa varies by county.
Applying For Iowa Food Stamp Programs
How do I apply for food stamps in Iowa?
There are 5 government food-related benefits that you may apply for as a resident of Iowa.
Want to explore more government assistance programs? Browse all government benefits available to Iowa residents.
Iowa Percentage of Households Receiving Food Stamps by City Statistics
How does the percentage of homes receiving food stamps compare across the largest cities in Iowa?
| City | Food Stamps | Details |
|---|---|---|
Ames |
1.4% |
Ames ranks 146th of 291 among cities in Iowa based on a sample of 25,123 Iowan households in Ames. |
Cedar Rapids |
1.4% |
Cedar Rapids ranks 142nd of 291 among cities in Iowa based on a sample of 54,433 Iowan households in Cedar Rapids. |
Council Bluffs |
1.7% |
Council Bluffs ranks 183rd of 291 among cities in Iowa based on a sample of 24,798 Iowan households in Council Bluffs. |
Davenport |
2.3% |
Davenport ranks 234th of 291 among cities in Iowa based on a sample of 40,488 Iowan households in Davenport. |
Des Moines |
2.3% |
Des Moines ranks 230th of 291 among cities in Iowa based on a sample of 83,916 Iowan households in Des Moines. |
Dubuque |
1.6% |
Dubuque ranks 165th of 291 among cities in Iowa based on a sample of 23,974 Iowan households in Dubuque. |
Iowa City |
1.3% |
Iowa City ranks 130th of 291 among cities in Iowa based on a sample of 29,697 Iowan households in Iowa City. |
Sioux City |
1.3% |
Sioux City ranks 138th of 291 among cities in Iowa based on a sample of 31,434 Iowan households in Sioux City. |
Waterloo |
2.7% |
Waterloo ranks 247th of 291 among cities in Iowa based on a sample of 28,468 Iowan households in Waterloo. |
West Des Moines |
1.2% |
West Des Moines ranks 127th of 291 among cities in Iowa based on a sample of 27,314 Iowan households in West Des Moines. |
Research & Reports
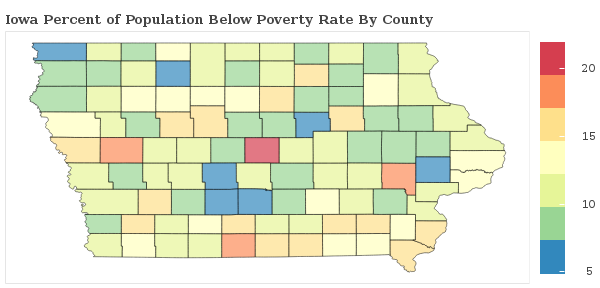
Iowa Poverty Statistics
Which areas have the highest rate of poverty in Iowa? We breakdown the poverty rate by city and county across Iowa and rank communities with the highest and lowest concentrations of residents living below the poverty line.
Iowa Poverty Statistics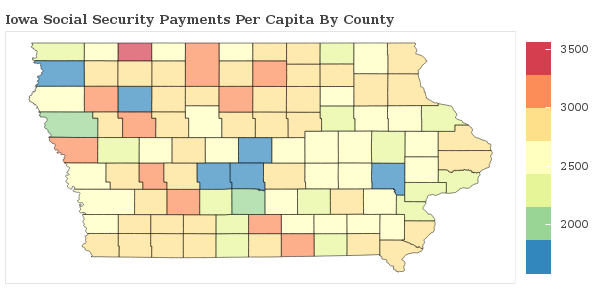
Social Security Payments in Iowa
How are the Social Security Payments distributed throughout Iowa? We breakdown social security benefits by city and county statewide and rank communities with the most and least social security income per capita.
Iowa Social Security
Food Stamps in America
Which areas receive the most food stamp public assistance in your state? We breakdown over 3,000 counties nationwide and rank communities with the most and least food and nutrional supplements given to residents.
See Food Stamp Statistics2018 Iowa Poverty Line
| Household Size | Poverty Level |
|---|---|
| 1 | $12,140 |
| 2 | $16,460 |
| 3 | $20,780 |
| 4 | $25,100 |
| 5 | $29,420 |
| 6 | $33,740 |
| Per Additional | +$4,320 |
The poverty line for Iowa in 2018 is based on the federal guidelines, which begins at $12,140 for a single person, adding $4,320 for each additional person.
Poverty In America
