Kansas Food Stamps
How does Kansas rank for percentage of homes receiving food stamps?
Kansas ranks 19th out of 50 states for lowest percentage of households receiving food stamps at 1.4%. The study is based on a total of 1,121,943 Kansan households who reported whether or not food stamps were received.
How many Kansas households received food stamps in the past year?
16,160 households in Kansas received food stamps within the last year.
Kansas Food Stamps Received Map
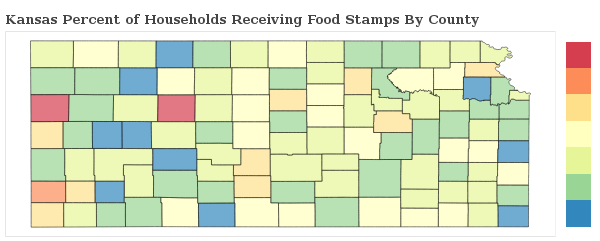
Kansas Food Stamps Received Map
Food Stamps Received By County
The percentage of households receiving food stamps in Kansas varies by county.
Applying For Kansas Food Stamp Programs
How do I apply for food stamps in Kansas?
There are 5 government food-related benefits that you may apply for as a resident of Kansas.
Want to explore more government assistance programs? Browse all government benefits available to Kansas residents.
Kansas Percentage of Households Receiving Food Stamps by City Statistics
How does the percentage of homes receiving food stamps compare across the largest cities in Kansas?
| City | Food Stamps | Details |
|---|---|---|
Kansas City |
1.6% |
Kansas City ranks 114th of 205 among cities in Kansas based on a sample of 54,975 Kansan households in Kansas City. |
Lawrence |
1.1% |
Lawrence ranks 91st of 205 among cities in Kansas based on a sample of 36,358 Kansan households in Lawrence. |
Lenexa |
1.7% |
Lenexa ranks 126th of 205 among cities in Kansas based on a sample of 20,694 Kansan households in Lenexa. |
Manhattan |
0.8% |
Manhattan ranks 68th of 205 among cities in Kansas based on a sample of 20,600 Kansan households in Manhattan. |
Olathe |
0.9% |
Olathe ranks 77th of 205 among cities in Kansas based on a sample of 46,526 Kansan households in Olathe. |
Overland Park |
0.8% |
Overland Park ranks 65th of 205 among cities in Kansas based on a sample of 76,621 Kansan households in Overland Park. |
Salina |
2.1% |
Salina ranks 160th of 205 among cities in Kansas based on a sample of 19,453 Kansan households in Salina. |
Shawnee |
1.0% |
Shawnee ranks 81st of 205 among cities in Kansas based on a sample of 24,390 Kansan households in Shawnee. |
Topeka |
2.0% |
Topeka ranks 148th of 205 among cities in Kansas based on a sample of 53,220 Kansan households in Topeka. |
Wichita |
1.6% |
Wichita ranks 120th of 205 among cities in Kansas based on a sample of 151,665 Kansan households in Wichita. |
Research & Reports

Kansas Poverty Statistics
Which areas have the highest rate of poverty in Kansas? We breakdown the poverty rate by city and county across Kansas and rank communities with the highest and lowest concentrations of residents living below the poverty line.
Kansas Poverty Statistics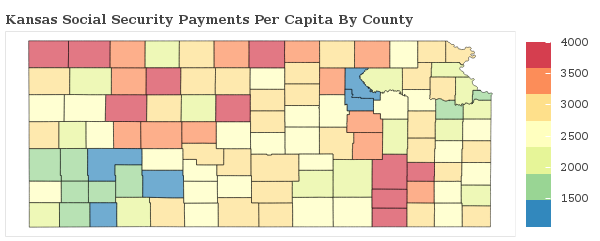
Social Security Payments in Kansas
How are the Social Security Payments distributed throughout Kansas? We breakdown social security benefits by city and county statewide and rank communities with the most and least social security income per capita.
Kansas Social Security
Food Stamps in America
Which areas receive the most food stamp public assistance in your state? We breakdown over 3,000 counties nationwide and rank communities with the most and least food and nutrional supplements given to residents.
See Food Stamp Statistics2018 Kansas Poverty Line
| Household Size | Poverty Level |
|---|---|
| 1 | $12,140 |
| 2 | $16,460 |
| 3 | $20,780 |
| 4 | $25,100 |
| 5 | $29,420 |
| 6 | $33,740 |
| Per Additional | +$4,320 |
The poverty line for Kansas in 2018 is based on the federal guidelines, which begins at $12,140 for a single person, adding $4,320 for each additional person.
Poverty In America
