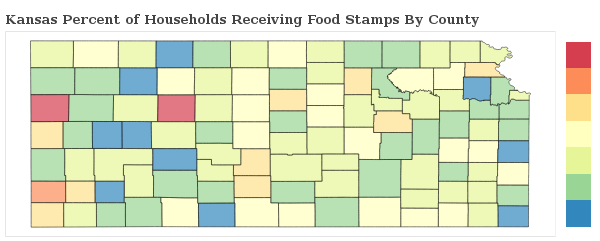
0.8% of Households Receive Food Stamps in Overland Park, Kansas
Food Stamps in Overland Park, Kansas
What percent of Households Receive Food Stamps in Overland Park?
The percentage of households receiving food stamps in the last year in Overland Park is 0.8%.
How Many Households in Overland Park Receive Food Stamps?
There are 619 households out of 76621 in Overland Park receiving food stamps.
Where does Overland Park Rank in Comparison to Other Kansas Cities for HouseHolds Receiving Food Stamps?
Overland Park ranks 65th out of 205 cities and towns in Kansas for the least number of households receiving food stamps. A smaller numeric rank indicates a lower percentage of homes receive food stamps.
How do other cities in Johnson County compare to Overland Park when it comes to the percentage of homes receiving Food Stamps?
Cities must have a minimum of 1,000 residents to qualify
| City | Food Stamps | Details |
|---|---|---|
De Soto |
0.0% |
0 of 2,328 De Soto households received food stamps within the past year. |
Edgerton |
0.7% |
4 of 595 Edgerton households received food stamps within the past year. |
Fairway |
2.4% |
42 of 1,734 Fairway households received food stamps within the past year. |
Gardner |
1.7% |
120 of 7,173 Gardner households received food stamps within the past year. |
Leawood |
1.1% |
138 of 12,680 Leawood households received food stamps within the past year. |
Lenexa |
1.7% |
354 of 20,694 Lenexa households received food stamps within the past year. |
Merriam |
1.2% |
62 of 5,132 Merriam households received food stamps within the past year. |
Mission |
0.5% |
22 of 4,842 Mission households received food stamps within the past year. |
Mission Hills |
0.5% |
6 of 1,234 Mission Hills households received food stamps within the past year. |
Olathe |
0.9% |
441 of 46,526 Olathe households received food stamps within the past year. |
Overland Park |
0.8% |
619 of 76,621 Overland Park households received food stamps within the past year. |
Prairie Village |
1.0% |
100 of 9,677 Prairie Village households received food stamps within the past year. |
Roeland Park |
1.3% |
39 of 2,990 Roeland Park households received food stamps within the past year. |
Shawnee |
1.0% |
238 of 24,390 Shawnee households received food stamps within the past year. |
Westwood |
0.4% |
3 of 740 Westwood households received food stamps within the past year. |
