Kentucky Food Stamps
How does Kentucky rank for percentage of homes receiving food stamps?
Kentucky ranks 32nd out of 50 states for lowest percentage of households receiving food stamps at 1.6%. The study is based on a total of 1,724,514 Kentuckian households who reported whether or not food stamps were received.
How many Kentucky households received food stamps in the past year?
27,411 households in Kentucky received food stamps within the last year.
Kentucky Food Stamps Received Map
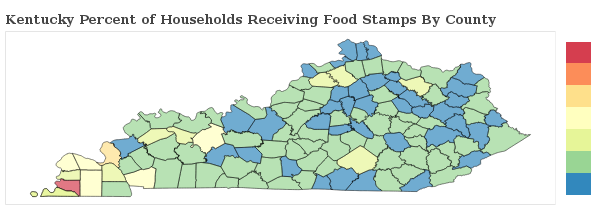
Kentucky Food Stamps Received Map
Food Stamps Received By County
The percentage of households receiving food stamps in Kentucky varies by county.
Applying For Kentucky Food Stamp Programs
How do I apply for food stamps in Kentucky?
There are 5 government food-related benefits that you may apply for as a resident of Kentucky.
Want to explore more government assistance programs? Browse all government benefits available to Kentucky residents.
Kentucky Percentage of Households Receiving Food Stamps by City Statistics
How does the percentage of homes receiving food stamps compare across the largest cities in Kentucky?
| City | Food Stamps | Details |
|---|---|---|
Bowling Green |
1.3% |
Bowling Green ranks 129th of 241 among cities in Kentucky based on a sample of 23,810 Kentuckian households in Bowling Green. |
Covington |
1.5% |
Covington ranks 149th of 241 among cities in Kentucky based on a sample of 16,949 Kentuckian households in Covington. |
Elizabethtown |
0.9% |
Elizabethtown ranks 94th of 241 among cities in Kentucky based on a sample of 12,411 Kentuckian households in Elizabethtown. |
Florence |
1.4% |
Florence ranks 139th of 241 among cities in Kentucky based on a sample of 12,765 Kentuckian households in Florence. |
Georgetown |
0.8% |
Georgetown ranks 86th of 241 among cities in Kentucky based on a sample of 12,150 Kentuckian households in Georgetown. |
Hopkinsville |
1.6% |
Hopkinsville ranks 154th of 241 among cities in Kentucky based on a sample of 12,685 Kentuckian households in Hopkinsville. |
Lexington-Fayette |
1.0% |
Lexington-Fayette ranks 103rd of 241 among cities in Kentucky based on a sample of 127,336 Kentuckian households in Lexington-Fayette. |
Louisville/Jefferson County metro government (balance) |
2.1% |
Louisville/Jefferson County metro government (balance) ranks 187th of 241 among cities in Kentucky based on a sample of 246,271 Kentuckian households in Louisville/Jefferson County metro government (balance). |
Owensboro |
2.1% |
Owensboro ranks 188th of 241 among cities in Kentucky based on a sample of 24,760 Kentuckian households in Owensboro. |
Richmond |
1.7% |
Richmond ranks 158th of 241 among cities in Kentucky based on a sample of 12,954 Kentuckian households in Richmond. |
Research & Reports
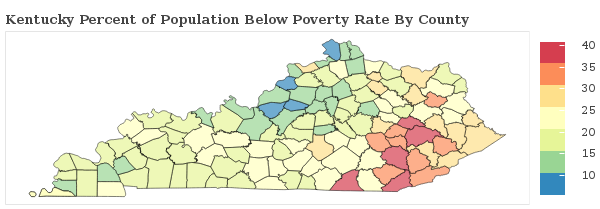
Kentucky Poverty Statistics
Which areas have the highest rate of poverty in Kentucky? We breakdown the poverty rate by city and county across Kentucky and rank communities with the highest and lowest concentrations of residents living below the poverty line.
Kentucky Poverty Statistics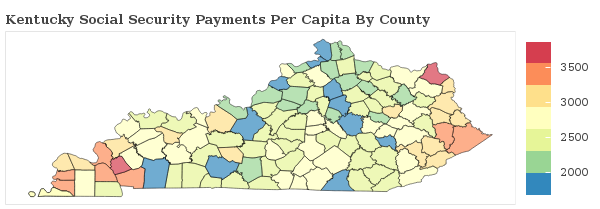
Social Security Payments in Kentucky
How are the Social Security Payments distributed throughout Kentucky? We breakdown social security benefits by city and county statewide and rank communities with the most and least social security income per capita.
Kentucky Social Security
Food Stamps in America
Which areas receive the most food stamp public assistance in your state? We breakdown over 3,000 counties nationwide and rank communities with the most and least food and nutrional supplements given to residents.
See Food Stamp Statistics2018 Kentucky Poverty Line
| Household Size | Poverty Level |
|---|---|
| 1 | $12,140 |
| 2 | $16,460 |
| 3 | $20,780 |
| 4 | $25,100 |
| 5 | $29,420 |
| 6 | $33,740 |
| Per Additional | +$4,320 |
The poverty line for Kentucky in 2018 is based on the federal guidelines, which begins at $12,140 for a single person, adding $4,320 for each additional person.
Poverty In America
