Wisconsin Food Stamps
How does Wisconsin rank for percentage of homes receiving food stamps?
Wisconsin ranks 14th out of 50 states for lowest percentage of households receiving food stamps at 1.4%. The study is based on a total of 2,328,754 Wisconsinite households who reported whether or not food stamps were received.
How many Wisconsin households received food stamps in the past year?
32,733 households in Wisconsin received food stamps within the last year.
Wisconsin Food Stamps Received Map
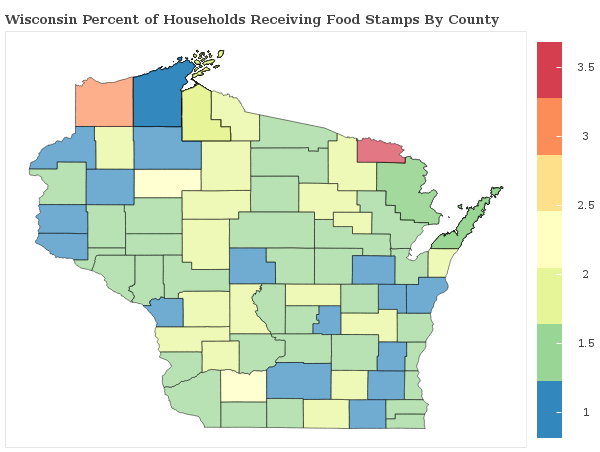
Wisconsin Food Stamps Received Map
Food Stamps Received By County
The percentage of households receiving food stamps in Wisconsin varies by county.
Applying For Wisconsin Food Stamp Programs
How do I apply for food stamps in Wisconsin?
There are 4 government food-related benefits that you may apply for as a resident of Wisconsin.
Want to explore more government assistance programs? Browse all government benefits available to Wisconsin residents.
Wisconsin Percentage of Households Receiving Food Stamps by City Statistics
How does the percentage of homes receiving food stamps compare across the largest cities in Wisconsin?
| City | Food Stamps | Details |
|---|---|---|
Appleton |
0.9% |
Appleton ranks 120th of 379 among cities in Wisconsin based on a sample of 28,892 Wisconsinite households in Appleton. |
Eau Claire |
1.5% |
Eau Claire ranks 215th of 379 among cities in Wisconsin based on a sample of 27,402 Wisconsinite households in Eau Claire. |
Green Bay |
1.4% |
Green Bay ranks 212th of 379 among cities in Wisconsin based on a sample of 42,559 Wisconsinite households in Green Bay. |
Janesville |
1.4% |
Janesville ranks 209th of 379 among cities in Wisconsin based on a sample of 26,470 Wisconsinite households in Janesville. |
Kenosha |
1.3% |
Kenosha ranks 187th of 379 among cities in Wisconsin based on a sample of 37,602 Wisconsinite households in Kenosha. |
Madison |
1.3% |
Madison ranks 181st of 379 among cities in Wisconsin based on a sample of 107,890 Wisconsinite households in Madison. |
Milwaukee |
1.6% |
Milwaukee ranks 241st of 379 among cities in Wisconsin based on a sample of 230,463 Wisconsinite households in Milwaukee. |
Oshkosh |
1.8% |
Oshkosh ranks 259th of 379 among cities in Wisconsin based on a sample of 26,373 Wisconsinite households in Oshkosh. |
Racine |
1.3% |
Racine ranks 179th of 379 among cities in Wisconsin based on a sample of 29,966 Wisconsinite households in Racine. |
Waukesha |
1.1% |
Waukesha ranks 158th of 379 among cities in Wisconsin based on a sample of 29,127 Wisconsinite households in Waukesha. |
Research & Reports
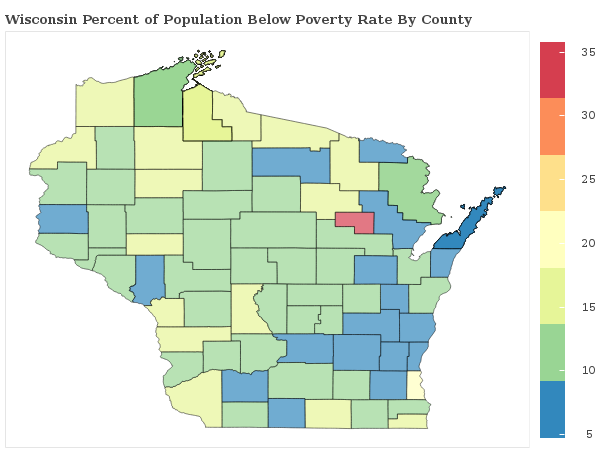
Wisconsin Poverty Statistics
Which areas have the highest rate of poverty in Wisconsin? We breakdown the poverty rate by city and county across Wisconsin and rank communities with the highest and lowest concentrations of residents living below the poverty line.
Wisconsin Poverty Statistics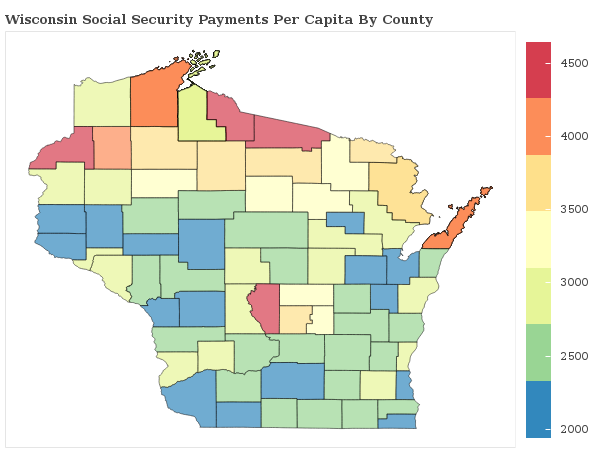
Social Security Payments in Wisconsin
How are the Social Security Payments distributed throughout Wisconsin? We breakdown social security benefits by city and county statewide and rank communities with the most and least social security income per capita.
Wisconsin Social Security
Food Stamps in America
Which areas receive the most food stamp public assistance in your state? We breakdown over 3,000 counties nationwide and rank communities with the most and least food and nutrional supplements given to residents.
See Food Stamp Statistics2018 Wisconsin Poverty Line
| Household Size | Poverty Level |
|---|---|
| 1 | $12,140 |
| 2 | $16,460 |
| 3 | $20,780 |
| 4 | $25,100 |
| 5 | $29,420 |
| 6 | $33,740 |
| Per Additional | +$4,320 |
The poverty line for Wisconsin in 2018 is based on the federal guidelines, which begins at $12,140 for a single person, adding $4,320 for each additional person.
Poverty In America
