South Dakota Food Stamps
How does South Dakota rank for percentage of homes receiving food stamps?
South Dakota ranks 9th out of 50 states for lowest percentage of households receiving food stamps at 1.3%. The study is based on a total of 339,458 South Dakotan households who reported whether or not food stamps were received.
How many South Dakota households received food stamps in the past year?
4,519 households in South Dakota received food stamps within the last year.
South Dakota Food Stamps Received Map
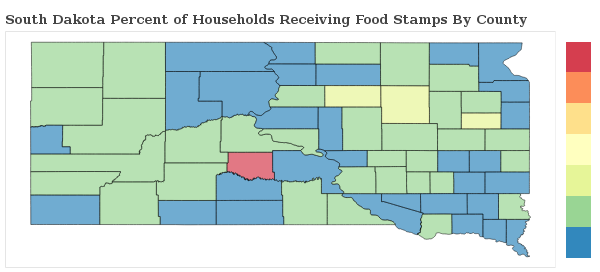
South Dakota Food Stamps Received Map
Food Stamps Received By County
The percentage of households receiving food stamps in South Dakota varies by county.
Applying For South Dakota Food Stamp Programs
How do I apply for food stamps in South Dakota?
There are 6 government food-related benefits that you may apply for as a resident of South Dakota.
Want to explore more government assistance programs? Browse all government benefits available to South Dakota residents.
South Dakota Percentage of Households Receiving Food Stamps by City Statistics
How does the percentage of homes receiving food stamps compare across the largest cities in South Dakota?
| City | Food Stamps | Details |
|---|---|---|
Aberdeen |
2.4% |
Aberdeen ranks 72nd of 77 among cities in South Dakota based on a sample of 12,075 South Dakotan households in Aberdeen. |
Brookings |
1.5% |
Brookings ranks 57th of 77 among cities in South Dakota based on a sample of 8,635 South Dakotan households in Brookings. |
Huron |
1.8% |
Huron ranks 62nd of 77 among cities in South Dakota based on a sample of 5,621 South Dakotan households in Huron. |
Mitchell |
1.5% |
Mitchell ranks 52nd of 77 among cities in South Dakota based on a sample of 7,044 South Dakotan households in Mitchell. |
Pierre |
1.7% |
Pierre ranks 59th of 77 among cities in South Dakota based on a sample of 6,049 South Dakotan households in Pierre. |
Rapid City |
1.9% |
Rapid City ranks 63rd of 77 among cities in South Dakota based on a sample of 29,723 South Dakotan households in Rapid City. |
Sioux Falls |
1.0% |
Sioux Falls ranks 40th of 77 among cities in South Dakota based on a sample of 69,055 South Dakotan households in Sioux Falls. |
Spearfish |
1.3% |
Spearfish ranks 50th of 77 among cities in South Dakota based on a sample of 4,853 South Dakotan households in Spearfish. |
Watertown |
2.0% |
Watertown ranks 66th of 77 among cities in South Dakota based on a sample of 9,555 South Dakotan households in Watertown. |
Yankton |
1.0% |
Yankton ranks 38th of 77 among cities in South Dakota based on a sample of 6,206 South Dakotan households in Yankton. |
Research & Reports
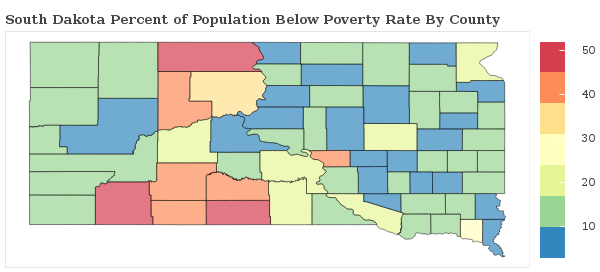
South Dakota Poverty Statistics
Which areas have the highest rate of poverty in South Dakota? We breakdown the poverty rate by city and county across South Dakota and rank communities with the highest and lowest concentrations of residents living below the poverty line.
South Dakota Poverty Statistics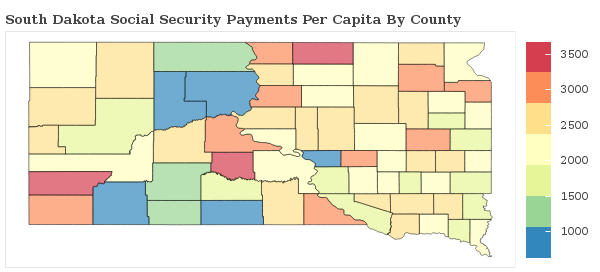
Social Security Payments in South Dakota
How are the Social Security Payments distributed throughout South Dakota? We breakdown social security benefits by city and county statewide and rank communities with the most and least social security income per capita.
South Dakota Social Security
Food Stamps in America
Which areas receive the most food stamp public assistance in your state? We breakdown over 3,000 counties nationwide and rank communities with the most and least food and nutrional supplements given to residents.
See Food Stamp Statistics2018 South Dakota Poverty Line
| Household Size | Poverty Level |
|---|---|
| 1 | $12,140 |
| 2 | $16,460 |
| 3 | $20,780 |
| 4 | $25,100 |
| 5 | $29,420 |
| 6 | $33,740 |
| Per Additional | +$4,320 |
The poverty line for South Dakota in 2018 is based on the federal guidelines, which begins at $12,140 for a single person, adding $4,320 for each additional person.
Poverty In America
