Georgia Food Stamps
How does Georgia rank for percentage of homes receiving food stamps?
Georgia ranks 42nd out of 50 states for lowest percentage of households receiving food stamps at 1.7%. The study is based on a total of 3,663,104 Georgian households who reported whether or not food stamps were received.
How many Georgia households received food stamps in the past year?
63,701 households in Georgia received food stamps within the last year.
Georgia Food Stamps Received Map
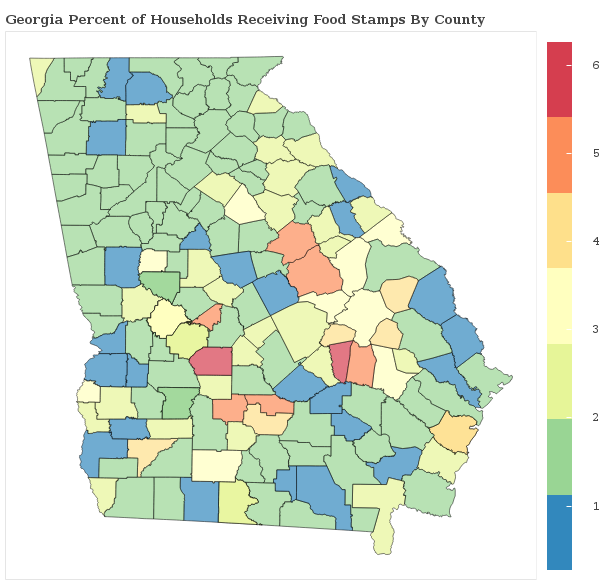
Georgia Food Stamps Received Map
Food Stamps Received By County
The percentage of households receiving food stamps in Georgia varies by county.
Applying For Georgia Food Stamp Programs
How do I apply for food stamps in Georgia?
There are 5 government food-related benefits that you may apply for as a resident of Georgia.
Want to explore more government assistance programs? Browse all government benefits available to Georgia residents.
Georgia Percentage of Households Receiving Food Stamps by City Statistics
How does the percentage of homes receiving food stamps compare across the largest cities in Georgia?
| City | Food Stamps | Details |
|---|---|---|
Albany |
2.9% |
Albany ranks 297th of 356 among cities in Georgia based on a sample of 28,496 Georgian households in Albany. |
Athens-Clarke County unified government (balance) |
1.4% |
Athens-Clarke County unified government (balance) ranks 165th of 356 among cities in Georgia based on a sample of 45,763 Georgian households in Athens-Clarke County unified government (balance). |
Atlanta |
1.8% |
Atlanta ranks 209th of 356 among cities in Georgia based on a sample of 192,929 Georgian households in Atlanta. |
Augusta-Richmond County consolidated government (balance) |
3.3% |
Augusta-Richmond County consolidated government (balance) ranks 314th of 356 among cities in Georgia based on a sample of 70,659 Georgian households in Augusta-Richmond County consolidated government (balance). |
Columbus |
1.5% |
Columbus ranks 179th of 356 among cities in Georgia based on a sample of 73,179 Georgian households in Columbus. |
Johns Creek |
1.6% |
Johns Creek ranks 184th of 356 among cities in Georgia based on a sample of 27,456 Georgian households in Johns Creek. |
Roswell |
1.1% |
Roswell ranks 129th of 356 among cities in Georgia based on a sample of 34,214 Georgian households in Roswell. |
Sandy Springs |
1.1% |
Sandy Springs ranks 134th of 356 among cities in Georgia based on a sample of 44,919 Georgian households in Sandy Springs. |
Savannah |
2.1% |
Savannah ranks 239th of 356 among cities in Georgia based on a sample of 53,664 Georgian households in Savannah. |
Warner Robins |
1.9% |
Warner Robins ranks 219th of 356 among cities in Georgia based on a sample of 28,574 Georgian households in Warner Robins. |
Research & Reports
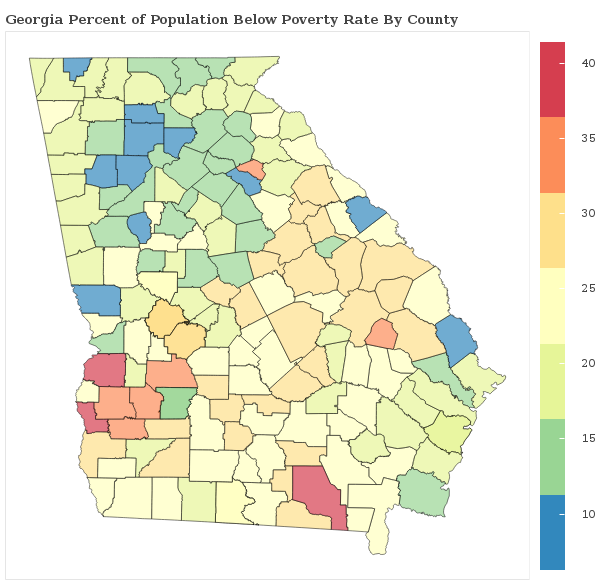
Georgia Poverty Statistics
Which areas have the highest rate of poverty in Georgia? We breakdown the poverty rate by city and county across Georgia and rank communities with the highest and lowest concentrations of residents living below the poverty line.
Georgia Poverty Statistics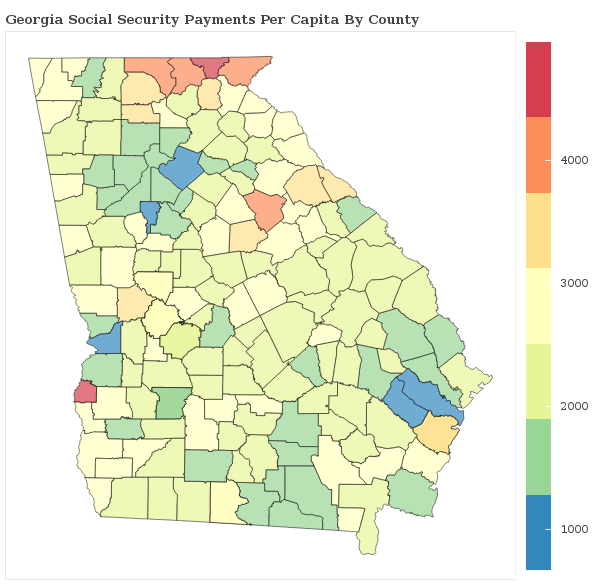
Social Security Payments in Georgia
How are the Social Security Payments distributed throughout Georgia? We breakdown social security benefits by city and county statewide and rank communities with the most and least social security income per capita.
Georgia Social Security
Food Stamps in America
Which areas receive the most food stamp public assistance in your state? We breakdown over 3,000 counties nationwide and rank communities with the most and least food and nutrional supplements given to residents.
See Food Stamp Statistics2018 Georgia Poverty Line
| Household Size | Poverty Level |
|---|---|
| 1 | $12,140 |
| 2 | $16,460 |
| 3 | $20,780 |
| 4 | $25,100 |
| 5 | $29,420 |
| 6 | $33,740 |
| Per Additional | +$4,320 |
The poverty line for Georgia in 2018 is based on the federal guidelines, which begins at $12,140 for a single person, adding $4,320 for each additional person.
Poverty In America
