Oklahoma Food Stamps
How does Oklahoma rank for percentage of homes receiving food stamps?
Oklahoma ranks 46th out of 50 states for lowest percentage of households receiving food stamps at 2.1%. The study is based on a total of 1,468,971 Oklahoman households who reported whether or not food stamps were received.
How many Oklahoma households received food stamps in the past year?
31,016 households in Oklahoma received food stamps within the last year.
Oklahoma Food Stamps Received Map
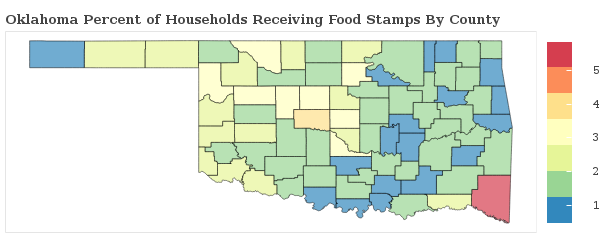
Oklahoma Food Stamps Received Map
Food Stamps Received By County
The percentage of households receiving food stamps in Oklahoma varies by county.
Applying For Oklahoma Food Stamp Programs
How do I apply for food stamps in Oklahoma?
There are 4 government food-related benefits that you may apply for as a resident of Oklahoma.
Want to explore more government assistance programs? Browse all government benefits available to Oklahoma residents.
Oklahoma Percentage of Households Receiving Food Stamps by City Statistics
How does the percentage of homes receiving food stamps compare across the largest cities in Oklahoma?
| City | Food Stamps | Details |
|---|---|---|
Broken Arrow |
1.1% |
Broken Arrow ranks 89th of 240 among cities in Oklahoma based on a sample of 38,432 Oklahoman households in Broken Arrow. |
Edmond |
2.3% |
Edmond ranks 170th of 240 among cities in Oklahoma based on a sample of 33,379 Oklahoman households in Edmond. |
Enid |
2.0% |
Enid ranks 147th of 240 among cities in Oklahoma based on a sample of 19,358 Oklahoman households in Enid. |
Lawton |
1.4% |
Lawton ranks 104th of 240 among cities in Oklahoma based on a sample of 33,045 Oklahoman households in Lawton. |
Midwest City |
5.4% |
Midwest City ranks 232nd of 240 among cities in Oklahoma based on a sample of 23,274 Oklahoman households in Midwest City. |
Moore |
2.7% |
Moore ranks 186th of 240 among cities in Oklahoma based on a sample of 22,628 Oklahoman households in Moore. |
Norman |
2.0% |
Norman ranks 145th of 240 among cities in Oklahoma based on a sample of 45,959 Oklahoman households in Norman. |
Oklahoma City |
3.1% |
Oklahoma City ranks 204th of 240 among cities in Oklahoma based on a sample of 237,895 Oklahoman households in Oklahoma City. |
Stillwater |
1.6% |
Stillwater ranks 123rd of 240 among cities in Oklahoma based on a sample of 18,567 Oklahoman households in Stillwater. |
Tulsa |
1.6% |
Tulsa ranks 121st of 240 among cities in Oklahoma based on a sample of 164,381 Oklahoman households in Tulsa. |
Research & Reports
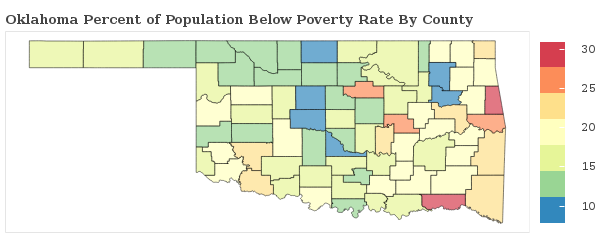
Oklahoma Poverty Statistics
Which areas have the highest rate of poverty in Oklahoma? We breakdown the poverty rate by city and county across Oklahoma and rank communities with the highest and lowest concentrations of residents living below the poverty line.
Oklahoma Poverty Statistics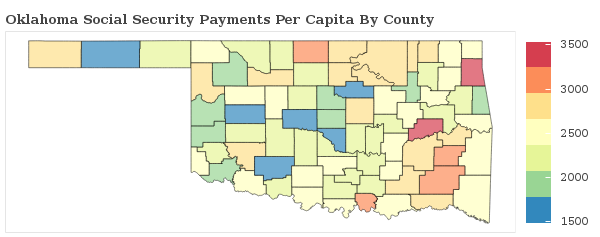
Social Security Payments in Oklahoma
How are the Social Security Payments distributed throughout Oklahoma? We breakdown social security benefits by city and county statewide and rank communities with the most and least social security income per capita.
Oklahoma Social Security
Food Stamps in America
Which areas receive the most food stamp public assistance in your state? We breakdown over 3,000 counties nationwide and rank communities with the most and least food and nutrional supplements given to residents.
See Food Stamp Statistics2018 Oklahoma Poverty Line
| Household Size | Poverty Level |
|---|---|
| 1 | $12,140 |
| 2 | $16,460 |
| 3 | $20,780 |
| 4 | $25,100 |
| 5 | $29,420 |
| 6 | $33,740 |
| Per Additional | +$4,320 |
The poverty line for Oklahoma in 2018 is based on the federal guidelines, which begins at $12,140 for a single person, adding $4,320 for each additional person.
Poverty In America
