Texas Food Stamps
How does Texas rank for percentage of homes receiving food stamps?
Texas ranks 12th out of 50 states for lowest percentage of households receiving food stamps at 1.4%. The study is based on a total of 9,430,419 Texan households who reported whether or not food stamps were received.
How many Texas households received food stamps in the past year?
130,235 households in Texas received food stamps within the last year.
Texas Food Stamps Received Map
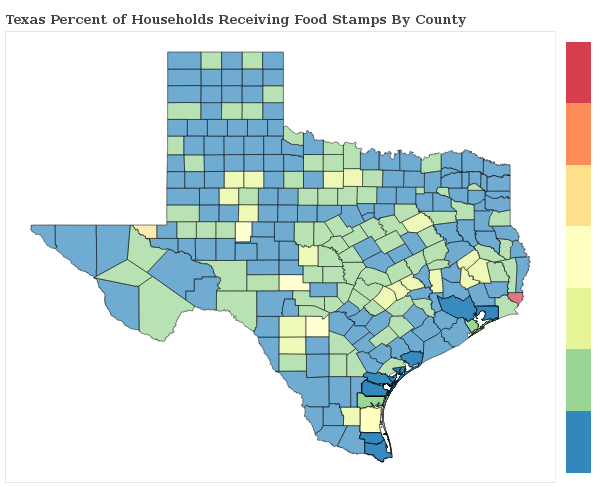
Texas Food Stamps Received Map
Food Stamps Received By County
The percentage of households receiving food stamps in Texas varies by county.
Applying For Texas Food Stamp Programs
How do I apply for food stamps in Texas?
There are 5 government food-related benefits that you may apply for as a resident of Texas.
Want to explore more government assistance programs? Browse all government benefits available to Texas residents.
Texas Percentage of Households Receiving Food Stamps by City Statistics
How does the percentage of homes receiving food stamps compare across the largest cities in Texas?
| City | Food Stamps | Details |
|---|---|---|
Arlington |
0.9% |
Arlington ranks 392nd of 983 among cities in Texas based on a sample of 135,004 Texan households in Arlington. |
Austin |
1.9% |
Austin ranks 749th of 983 among cities in Texas based on a sample of 361,257 Texan households in Austin. |
Corpus Christi |
1.0% |
Corpus Christi ranks 466th of 983 among cities in Texas based on a sample of 116,682 Texan households in Corpus Christi. |
Dallas |
1.1% |
Dallas ranks 483rd of 983 among cities in Texas based on a sample of 497,622 Texan households in Dallas. |
El Paso |
1.1% |
El Paso ranks 492nd of 983 among cities in Texas based on a sample of 223,164 Texan households in El Paso. |
Fort Worth |
1.3% |
Fort Worth ranks 558th of 983 among cities in Texas based on a sample of 284,687 Texan households in Fort Worth. |
Houston |
1.3% |
Houston ranks 589th of 983 among cities in Texas based on a sample of 838,950 Texan households in Houston. |
Laredo |
0.8% |
Laredo ranks 376th of 983 among cities in Texas based on a sample of 68,822 Texan households in Laredo. |
Plano |
1.1% |
Plano ranks 502nd of 983 among cities in Texas based on a sample of 105,806 Texan households in Plano. |
San Antonio |
1.1% |
San Antonio ranks 505th of 983 among cities in Texas based on a sample of 494,260 Texan households in San Antonio. |
Research & Reports
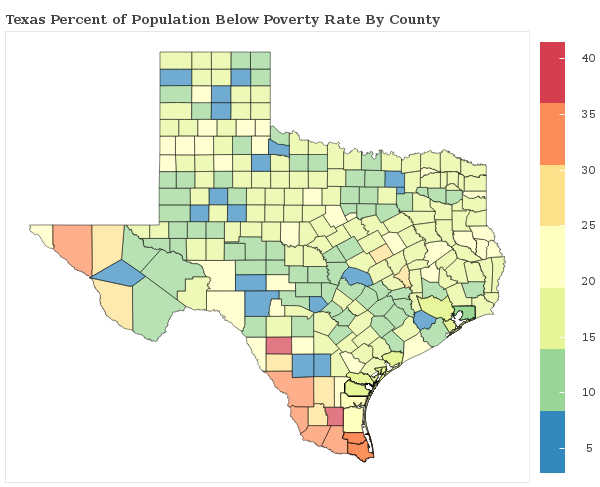
Texas Poverty Statistics
Which areas have the highest rate of poverty in Texas? We breakdown the poverty rate by city and county across Texas and rank communities with the highest and lowest concentrations of residents living below the poverty line.
Texas Poverty Statistics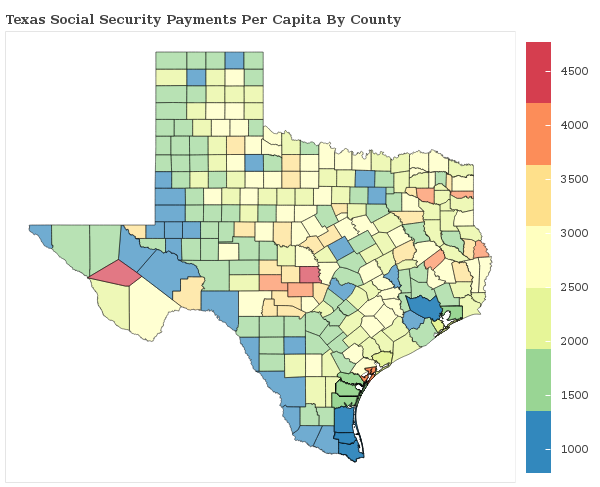
Social Security Payments in Texas
How are the Social Security Payments distributed throughout Texas? We breakdown social security benefits by city and county statewide and rank communities with the most and least social security income per capita.
Texas Social Security
Food Stamps in America
Which areas receive the most food stamp public assistance in your state? We breakdown over 3,000 counties nationwide and rank communities with the most and least food and nutrional supplements given to residents.
See Food Stamp Statistics2018 Texas Poverty Line
| Household Size | Poverty Level |
|---|---|
| 1 | $12,140 |
| 2 | $16,460 |
| 3 | $20,780 |
| 4 | $25,100 |
| 5 | $29,420 |
| 6 | $33,740 |
| Per Additional | +$4,320 |
The poverty line for Texas in 2018 is based on the federal guidelines, which begins at $12,140 for a single person, adding $4,320 for each additional person.
Poverty In America
