1.3% of Households Receive Food Stamps in Houston, Texas
Food Stamps in Houston, Texas
What percent of Households Receive Food Stamps in Houston?
The percentage of households receiving food stamps in the last year in Houston is 1.3%.
How Many Households in Houston Receive Food Stamps?
There are 11306 households out of 838950 in Houston receiving food stamps.
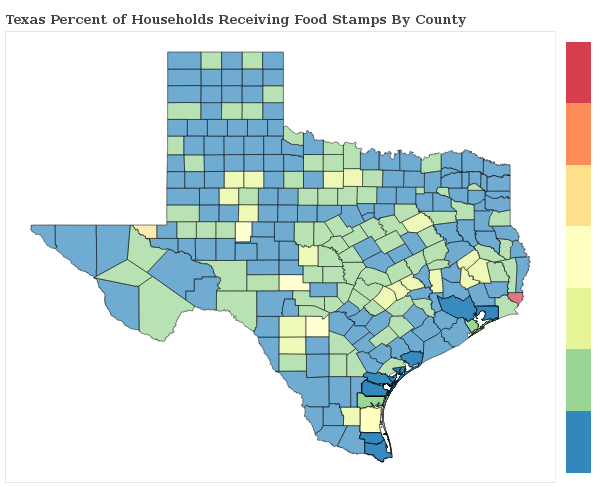
Where does Houston Rank in Comparison to Other Texas Cities for HouseHolds Receiving Food Stamps?
Houston ranks 589th out of 983 cities and towns in Texas for the least number of households receiving food stamps. A smaller numeric rank indicates a lower percentage of homes receive food stamps.
Here is a comparison of Food Stamps by city(minimum 1,000 residents) in Fort Bend County, Harris County, Montgomery County.
| City | Food Stamps | Details |
|---|---|---|
Arcola |
1.5% |
9 of 610 Arcola households received food stamps within the past year. |
Fifth Street |
0.0% |
0 of 609 Fifth Street households received food stamps within the past year. |
Four Corners |
1.0% |
33 of 3,302 Four Corners households received food stamps within the past year. |
Fresno |
1.6% |
108 of 6,684 Fresno households received food stamps within the past year. |
Fulshear |
1.4% |
26 of 1,808 Fulshear households received food stamps within the past year. |
Greatwood |
0.5% |
20 of 4,045 Greatwood households received food stamps within the past year. |
Meadows Place |
0.3% |
5 of 1,498 Meadows Place households received food stamps within the past year. |
Needville |
2.5% |
29 of 1,172 Needville households received food stamps within the past year. |
New Territory |
1.1% |
48 of 4,420 New Territory households received food stamps within the past year. |
Pecan Grove |
2.3% |
140 of 6,028 Pecan Grove households received food stamps within the past year. |
Pleak |
1.3% |
6 of 463 Pleak households received food stamps within the past year. |
Richmond |
0.6% |
21 of 3,583 Richmond households received food stamps within the past year. |
Rosenberg |
0.4% |
48 of 11,561 Rosenberg households received food stamps within the past year. |
Sienna Plantation |
0.9% |
41 of 4,765 Sienna Plantation households received food stamps within the past year. |
Sugar Land |
1.7% |
478 of 28,856 Sugar Land households received food stamps within the past year. |
Weston Lakes |
2.7% |
34 of 1,247 Weston Lakes households received food stamps within the past year. |