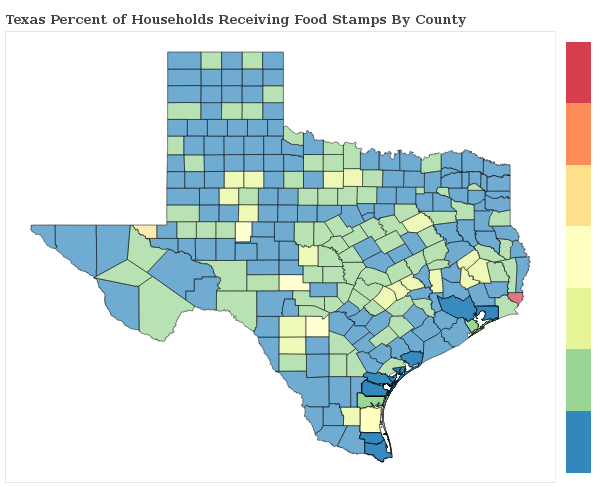
1.1% of Households Receive Food Stamps in El Paso, Texas
Food Stamps in El Paso, Texas
What percent of Households Receive Food Stamps in El Paso?
The percentage of households receiving food stamps in the last year in El Paso is 1.1%.
How Many Households in El Paso Receive Food Stamps?
There are 2452 households out of 223164 in El Paso receiving food stamps.
Where does El Paso Rank in Comparison to Other Texas Cities for HouseHolds Receiving Food Stamps?
El Paso ranks 492nd out of 983 cities and towns in Texas for the least number of households receiving food stamps. A smaller numeric rank indicates a lower percentage of homes receive food stamps.
How do other cities in El Paso County compare to El Paso when it comes to the percentage of homes receiving Food Stamps?
Cities must have a minimum of 1,000 residents to qualify
| City | Food Stamps | Details |
|---|---|---|
Agua Dulce |
1.4% |
10 of 739 Agua Dulce households received food stamps within the past year. |
Anthony |
0.2% |
2 of 1,327 Anthony households received food stamps within the past year. |
Canutillo |
0.9% |
13 of 1,414 Canutillo households received food stamps within the past year. |
El Paso |
1.1% |
2452 of 223,164 El Paso households received food stamps within the past year. |
Fabens |
0.0% |
0 of 1,850 Fabens households received food stamps within the past year. |
Fort Bliss |
0.4% |
7 of 1,663 Fort Bliss households received food stamps within the past year. |
Homestead Meadows North |
0.6% |
9 of 1,436 Homestead Meadows North households received food stamps within the past year. |
Homestead Meadows South |
0.5% |
8 of 1,652 Homestead Meadows South households received food stamps within the past year. |
Horizon City |
0.4% |
22 of 5,401 Horizon City households received food stamps within the past year. |
San Elizario |
0.7% |
17 of 2,407 San Elizario households received food stamps within the past year. |
Socorro |
0.7% |
62 of 9,071 Socorro households received food stamps within the past year. |
Sparks |
1.3% |
13 of 977 Sparks households received food stamps within the past year. |
Tornillo |
0.0% |
0 of 301 Tornillo households received food stamps within the past year. |
Vinton |
0.0% |
0 of 433 Vinton households received food stamps within the past year. |
Westway |
0.7% |
7 of 1,075 Westway households received food stamps within the past year. |
