0.9% of Households Receive Food Stamps in Arlington, Texas
Food Stamps in Arlington, Texas
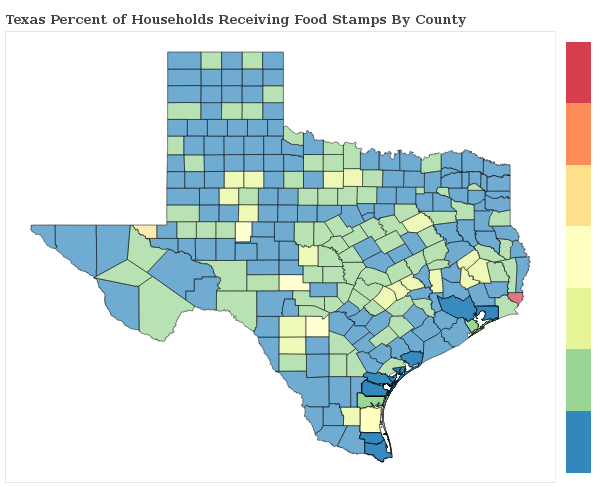
What percent of Households Receive Food Stamps in Arlington?
The percentage of households receiving food stamps in the last year in Arlington is 0.9%.
How Many Households in Arlington Receive Food Stamps?
There are 1200 households out of 135004 in Arlington receiving food stamps.
Where does Arlington Rank in Comparison to Other Texas Cities for HouseHolds Receiving Food Stamps?
Arlington ranks 392nd out of 983 cities and towns in Texas for the least number of households receiving food stamps. A smaller numeric rank indicates a lower percentage of homes receive food stamps.
How do other cities in Tarrant County compare to Arlington when it comes to the percentage of homes receiving Food Stamps?
Cities must have a minimum of 1,000 residents to qualify
| City | Food Stamps | Details |
|---|---|---|
Arlington |
0.9% |
1200 of 135,004 Arlington households received food stamps within the past year. |
Bedford |
1.4% |
286 of 20,927 Bedford households received food stamps within the past year. |
Benbrook |
1.5% |
145 of 9,511 Benbrook households received food stamps within the past year. |
Blue Mound |
0.5% |
5 of 949 Blue Mound households received food stamps within the past year. |
Colleyville |
1.7% |
152 of 8,854 Colleyville households received food stamps within the past year. |
Dalworthington Gardens |
0.5% |
4 of 784 Dalworthington Gardens households received food stamps within the past year. |
Edgecliff Village |
1.0% |
10 of 996 Edgecliff Village households received food stamps within the past year. |
Euless |
1.3% |
276 of 21,334 Euless households received food stamps within the past year. |
Everman |
3.2% |
60 of 1,903 Everman households received food stamps within the past year. |
Forest Hill |
1.0% |
39 of 3,802 Forest Hill households received food stamps within the past year. |
Haltom City |
1.3% |
184 of 14,315 Haltom City households received food stamps within the past year. |
Hurst |
1.7% |
241 of 14,095 Hurst households received food stamps within the past year. |
Keller |
1.2% |
178 of 14,949 Keller households received food stamps within the past year. |
Kennedale |
0.4% |
11 of 2,639 Kennedale households received food stamps within the past year. |
Lakeside |
2.5% |
15 of 606 Lakeside households received food stamps within the past year. |
Lake Worth |
2.4% |
38 of 1,574 Lake Worth households received food stamps within the past year. |
North Richland Hills |
1.6% |
418 of 26,135 North Richland Hills households received food stamps within the past year. |
Pantego |
2.0% |
21 of 1,062 Pantego households received food stamps within the past year. |
Pelican Bay |
3.7% |
21 of 563 Pelican Bay households received food stamps within the past year. |
Rendon |
1.5% |
67 of 4,504 Rendon households received food stamps within the past year. |
Richland Hills |
2.7% |
82 of 3,063 Richland Hills households received food stamps within the past year. |
River Oaks |
2.4% |
65 of 2,669 River Oaks households received food stamps within the past year. |
Saginaw |
0.7% |
51 of 7,100 Saginaw households received food stamps within the past year. |
Sansom Park |
0.6% |
8 of 1,310 Sansom Park households received food stamps within the past year. |
Watauga |
1.8% |
140 of 7,948 Watauga households received food stamps within the past year. |
Westworth Village |
0.0% |
0 of 1,125 Westworth Village households received food stamps within the past year. |
White Settlement |
1.8% |
109 of 6,171 White Settlement households received food stamps within the past year. |