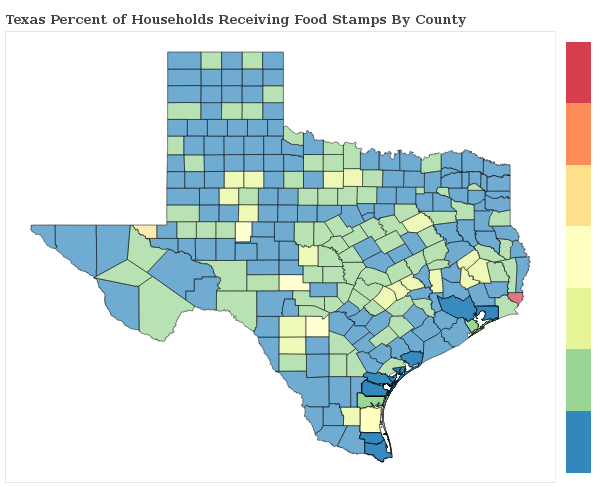
1.3% of Households Receive Food Stamps in Fort Worth, Texas
Food Stamps in Fort Worth, Texas
What percent of Households Receive Food Stamps in Fort Worth?
The percentage of households receiving food stamps in the last year in Fort Worth is 1.3%.
How Many Households in Fort Worth Receive Food Stamps?
There are 3616 households out of 284687 in Fort Worth receiving food stamps.
Where does Fort Worth Rank in Comparison to Other Texas Cities for HouseHolds Receiving Food Stamps?
Fort Worth ranks 558th out of 983 cities and towns in Texas for the least number of households receiving food stamps. A smaller numeric rank indicates a lower percentage of homes receive food stamps.
Here is a comparison of Food Stamps by city(minimum 1,000 residents) in Denton County, Parker County, Tarrant County, Wise County.
| City | Food Stamps | Details |
|---|---|---|
Argyle |
3.8% |
56 of 1,459 Argyle households received food stamps within the past year. |
Aubrey |
2.4% |
27 of 1,129 Aubrey households received food stamps within the past year. |
Bartonville |
1.0% |
6 of 612 Bartonville households received food stamps within the past year. |
Copper Canyon |
0.4% |
3 of 754 Copper Canyon households received food stamps within the past year. |
Corinth |
2.3% |
166 of 7,142 Corinth households received food stamps within the past year. |
Cross Roads |
1.0% |
5 of 494 Cross Roads households received food stamps within the past year. |
Denton |
0.9% |
425 of 45,874 Denton households received food stamps within the past year. |
Double Oak |
2.4% |
25 of 1,038 Double Oak households received food stamps within the past year. |
Hackberry |
0.0% |
0 of 672 Hackberry households received food stamps within the past year. |
Hickory Creek |
0.4% |
7 of 1,657 Hickory Creek households received food stamps within the past year. |
Highland Village |
0.6% |
33 of 5,334 Highland Village households received food stamps within the past year. |
Justin |
0.9% |
10 of 1,136 Justin households received food stamps within the past year. |
Krugerville |
1.3% |
8 of 625 Krugerville households received food stamps within the past year. |
Krum |
1.0% |
16 of 1,537 Krum households received food stamps within the past year. |
Lake Dallas |
0.2% |
6 of 2,792 Lake Dallas households received food stamps within the past year. |
Lantana |
0.0% |
0 of 2,870 Lantana households received food stamps within the past year. |
Little Elm |
0.8% |
95 of 12,421 Little Elm households received food stamps within the past year. |
Northlake |
2.7% |
24 of 897 Northlake households received food stamps within the past year. |
Oak Point |
2.6% |
33 of 1,284 Oak Point households received food stamps within the past year. |
Paloma Creek |
0.0% |
0 of 1,176 Paloma Creek households received food stamps within the past year. |
Paloma Creek South |
0.0% |
0 of 2,180 Paloma Creek South households received food stamps within the past year. |
Pilot Point |
1.3% |
20 of 1,555 Pilot Point households received food stamps within the past year. |
Ponder |
3.0% |
16 of 540 Ponder households received food stamps within the past year. |
Sanger |
1.8% |
49 of 2,799 Sanger households received food stamps within the past year. |
Savannah |
0.0% |
0 of 1,515 Savannah households received food stamps within the past year. |
Shady Shores |
0.9% |
9 of 951 Shady Shores households received food stamps within the past year. |
The Colony |
1.8% |
278 of 15,570 The Colony households received food stamps within the past year. |