Maine Food Stamps
How does Maine rank for percentage of homes receiving food stamps?
Maine ranks 1st out of 50 states for lowest percentage of households receiving food stamps at 1.1%. The study is based on a total of 554,061 Mainer households who reported whether or not food stamps were received.
How many Maine households received food stamps in the past year?
6,294 households in Maine received food stamps within the last year.
Maine Food Stamps Received Map
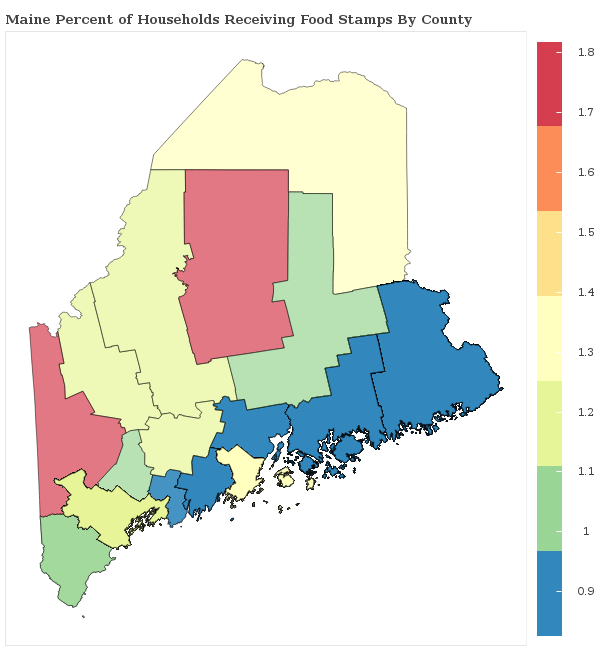
Maine Food Stamps Received Map
Food Stamps Received By County
The percentage of households receiving food stamps in Maine varies by county.
Applying For Maine Food Stamp Programs
How do I apply for food stamps in Maine?
There are 5 government food-related benefits that you may apply for as a resident of Maine.
Want to explore more government assistance programs? Browse all government benefits available to Maine residents.
Maine Percentage of Households Receiving Food Stamps by City Statistics
How does the percentage of homes receiving food stamps compare across the largest cities in Maine?
| City | Food Stamps | Details |
|---|---|---|
Auburn |
1.3% |
Auburn ranks 62nd of 100 among cities in Maine based on a sample of 9,916 Mainer households in Auburn. |
Augusta |
0.4% |
Augusta ranks 38th of 100 among cities in Maine based on a sample of 8,544 Mainer households in Augusta. |
Bangor |
1.5% |
Bangor ranks 68th of 100 among cities in Maine based on a sample of 14,035 Mainer households in Bangor. |
Biddeford |
1.1% |
Biddeford ranks 53rd of 100 among cities in Maine based on a sample of 8,545 Mainer households in Biddeford. |
Lewiston |
1.1% |
Lewiston ranks 54th of 100 among cities in Maine based on a sample of 16,063 Mainer households in Lewiston. |
Portland |
1.2% |
Portland ranks 56th of 100 among cities in Maine based on a sample of 30,167 Mainer households in Portland. |
Saco |
2.0% |
Saco ranks 80th of 100 among cities in Maine based on a sample of 7,712 Mainer households in Saco. |
Sanford |
0.7% |
Sanford ranks 43rd of 100 among cities in Maine based on a sample of 8,720 Mainer households in Sanford. |
South Portland |
1.3% |
South Portland ranks 64th of 100 among cities in Maine based on a sample of 10,663 Mainer households in South Portland. |
Westbrook |
2.1% |
Westbrook ranks 82nd of 100 among cities in Maine based on a sample of 8,054 Mainer households in Westbrook. |
Research & Reports
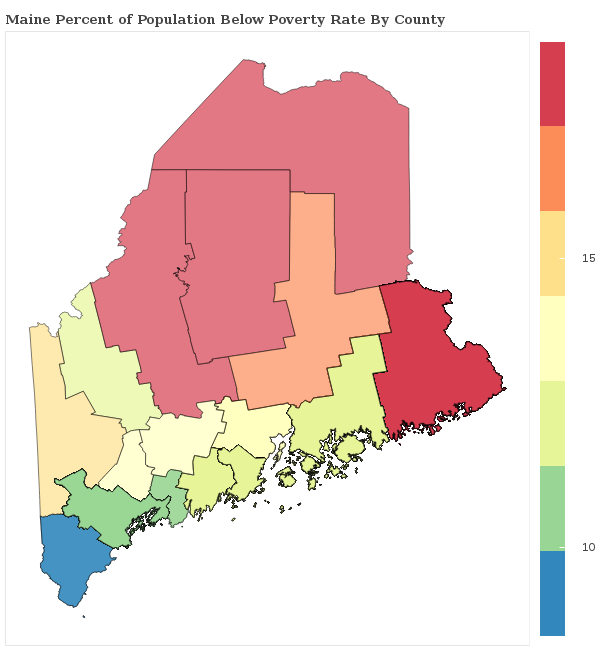
Maine Poverty Statistics
Which areas have the highest rate of poverty in Maine? We breakdown the poverty rate by city and county across Maine and rank communities with the highest and lowest concentrations of residents living below the poverty line.
Maine Poverty Statistics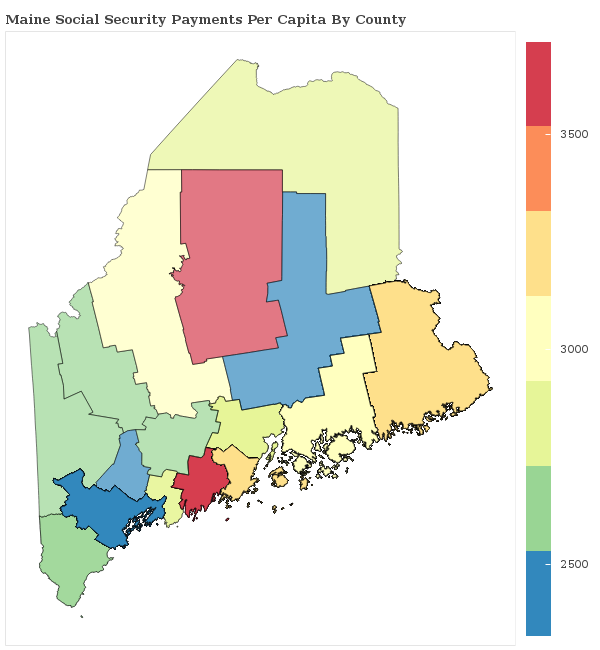
Social Security Payments in Maine
How are the Social Security Payments distributed throughout Maine? We breakdown social security benefits by city and county statewide and rank communities with the most and least social security income per capita.
Maine Social Security
Food Stamps in America
Which areas receive the most food stamp public assistance in your state? We breakdown over 3,000 counties nationwide and rank communities with the most and least food and nutrional supplements given to residents.
See Food Stamp Statistics2018 Maine Poverty Line
| Household Size | Poverty Level |
|---|---|
| 1 | $12,140 |
| 2 | $16,460 |
| 3 | $20,780 |
| 4 | $25,100 |
| 5 | $29,420 |
| 6 | $33,740 |
| Per Additional | +$4,320 |
The poverty line for Maine in 2018 is based on the federal guidelines, which begins at $12,140 for a single person, adding $4,320 for each additional person.
Poverty In America
