Ohio Food Stamps
How does Ohio rank for percentage of homes receiving food stamps?
Ohio ranks 21st out of 50 states for lowest percentage of households receiving food stamps at 1.5%. The study is based on a total of 4,633,145 Ohioan households who reported whether or not food stamps were received.
How many Ohio households received food stamps in the past year?
67,748 households in Ohio received food stamps within the last year.
Ohio Food Stamps Received Map
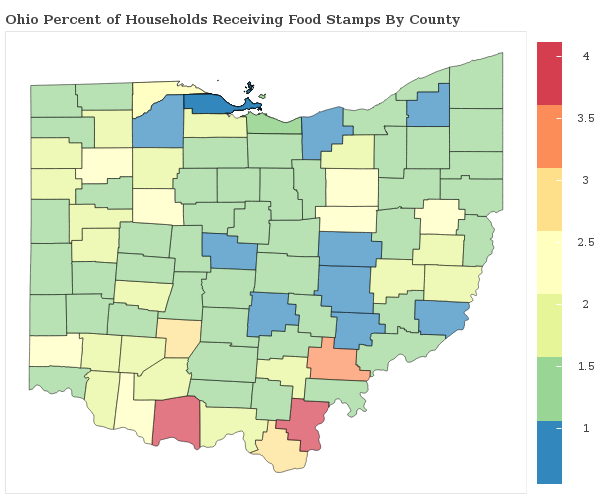
Ohio Food Stamps Received Map
Food Stamps Received By County
The percentage of households receiving food stamps in Ohio varies by county.
Applying For Ohio Food Stamp Programs
How do I apply for food stamps in Ohio?
There are 4 government food-related benefits that you may apply for as a resident of Ohio.
Want to explore more government assistance programs? Browse all government benefits available to Ohio residents.
Ohio Percentage of Households Receiving Food Stamps by City Statistics
How does the percentage of homes receiving food stamps compare across the largest cities in Ohio?
| City | Food Stamps | Details |
|---|---|---|
Akron |
1.3% |
Akron ranks 356th of 667 among cities in Ohio based on a sample of 84,443 Ohioan households in Akron. |
Canton |
1.4% |
Canton ranks 386th of 667 among cities in Ohio based on a sample of 30,530 Ohioan households in Canton. |
Cincinnati |
1.9% |
Cincinnati ranks 488th of 667 among cities in Ohio based on a sample of 136,180 Ohioan households in Cincinnati. |
Cleveland |
1.8% |
Cleveland ranks 475th of 667 among cities in Ohio based on a sample of 168,496 Ohioan households in Cleveland. |
Columbus |
1.3% |
Columbus ranks 362nd of 667 among cities in Ohio based on a sample of 345,282 Ohioan households in Columbus. |
Dayton |
1.9% |
Dayton ranks 504th of 667 among cities in Ohio based on a sample of 57,778 Ohioan households in Dayton. |
Lorain |
1.1% |
Lorain ranks 313th of 667 among cities in Ohio based on a sample of 25,330 Ohioan households in Lorain. |
Parma |
1.1% |
Parma ranks 310th of 667 among cities in Ohio based on a sample of 33,491 Ohioan households in Parma. |
Toledo |
2.1% |
Toledo ranks 522nd of 667 among cities in Ohio based on a sample of 118,215 Ohioan households in Toledo. |
Youngstown |
1.4% |
Youngstown ranks 376th of 667 among cities in Ohio based on a sample of 27,201 Ohioan households in Youngstown. |
Research & Reports
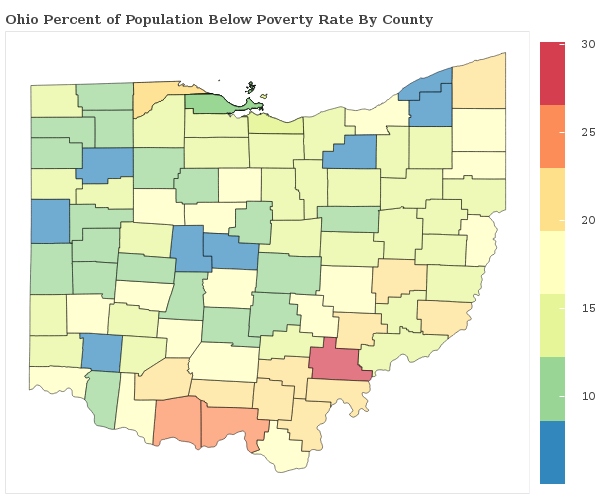
Ohio Poverty Statistics
Which areas have the highest rate of poverty in Ohio? We breakdown the poverty rate by city and county across Ohio and rank communities with the highest and lowest concentrations of residents living below the poverty line.
Ohio Poverty Statistics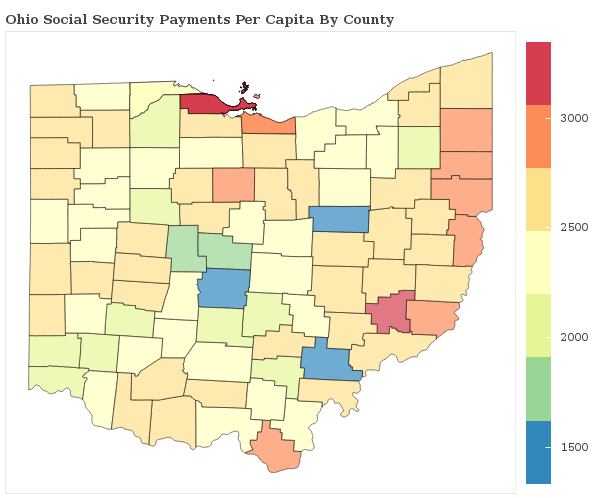
Social Security Payments in Ohio
How are the Social Security Payments distributed throughout Ohio? We breakdown social security benefits by city and county statewide and rank communities with the most and least social security income per capita.
Ohio Social Security
Food Stamps in America
Which areas receive the most food stamp public assistance in your state? We breakdown over 3,000 counties nationwide and rank communities with the most and least food and nutrional supplements given to residents.
See Food Stamp Statistics2018 Ohio Poverty Line
| Household Size | Poverty Level |
|---|---|
| 1 | $12,140 |
| 2 | $16,460 |
| 3 | $20,780 |
| 4 | $25,100 |
| 5 | $29,420 |
| 6 | $33,740 |
| Per Additional | +$4,320 |
The poverty line for Ohio in 2018 is based on the federal guidelines, which begins at $12,140 for a single person, adding $4,320 for each additional person.
Poverty In America
