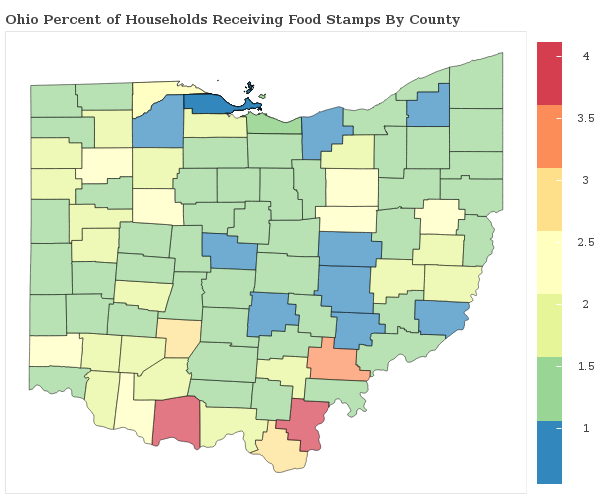
1.9% of Households Receive Food Stamps in Dayton, Ohio
Food Stamps in Dayton, Ohio
What percent of Households Receive Food Stamps in Dayton?
The percentage of households receiving food stamps in the last year in Dayton is 1.9%.
How Many Households in Dayton Receive Food Stamps?
There are 1124 households out of 57778 in Dayton receiving food stamps.
Where does Dayton Rank in Comparison to Other Ohio Cities for HouseHolds Receiving Food Stamps?
Dayton ranks 504th out of 667 cities and towns in Ohio for the least number of households receiving food stamps. A smaller numeric rank indicates a lower percentage of homes receive food stamps.
How do other cities in Montgomery County compare to Dayton when it comes to the percentage of homes receiving Food Stamps?
Cities must have a minimum of 1,000 residents to qualify
| City | Food Stamps | Details |
|---|---|---|
Brookville |
3.0% |
82 of 2,744 Brookville households received food stamps within the past year. |
Clayton |
2.2% |
109 of 5,046 Clayton households received food stamps within the past year. |
Dayton |
1.9% |
1124 of 57,778 Dayton households received food stamps within the past year. |
Drexel |
1.4% |
10 of 696 Drexel households received food stamps within the past year. |
Englewood |
0.0% |
0 of 5,734 Englewood households received food stamps within the past year. |
Farmersville |
0.7% |
3 of 429 Farmersville households received food stamps within the past year. |
Germantown |
1.4% |
29 of 2,102 Germantown households received food stamps within the past year. |
Miamisburg |
1.0% |
78 of 8,110 Miamisburg households received food stamps within the past year. |
Moraine |
2.9% |
71 of 2,409 Moraine households received food stamps within the past year. |
New Lebanon |
9.2% |
135 of 1,467 New Lebanon households received food stamps within the past year. |
Oakwood |
0.6% |
20 of 3,456 Oakwood households received food stamps within the past year. |
Riverside |
1.4% |
151 of 10,471 Riverside households received food stamps within the past year. |
Trotwood |
1.8% |
189 of 10,407 Trotwood households received food stamps within the past year. |
Vandalia |
0.5% |
33 of 6,756 Vandalia households received food stamps within the past year. |
West Carrollton |
0.9% |
54 of 5,750 West Carrollton households received food stamps within the past year. |
