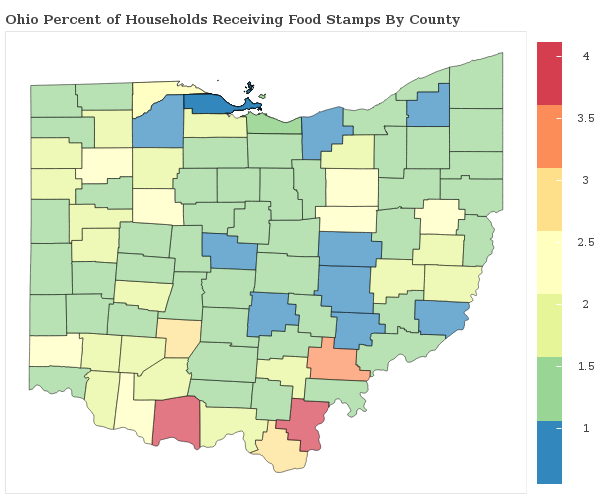
1.4% of Households Receive Food Stamps in Youngstown, Ohio
Food Stamps in Youngstown, Ohio
What percent of Households Receive Food Stamps in Youngstown?
The percentage of households receiving food stamps in the last year in Youngstown is 1.4%.
How Many Households in Youngstown Receive Food Stamps?
There are 370 households out of 27201 in Youngstown receiving food stamps.
Where does Youngstown Rank in Comparison to Other Ohio Cities for HouseHolds Receiving Food Stamps?
Youngstown ranks 376th out of 667 cities and towns in Ohio for the least number of households receiving food stamps. A smaller numeric rank indicates a lower percentage of homes receive food stamps.
Here is a comparison of Food Stamps by city(minimum 1,000 residents) in Mahoning County, Trumbull County.
| City | Food Stamps | Details |
|---|---|---|
Austintown |
0.9% |
116 of 13,045 Austintown households received food stamps within the past year. |
Boardman |
0.6% |
90 of 15,103 Boardman households received food stamps within the past year. |
Campbell |
0.8% |
27 of 3,374 Campbell households received food stamps within the past year. |
Canfield |
1.4% |
43 of 3,104 Canfield households received food stamps within the past year. |
Craig Beach |
0.6% |
3 of 501 Craig Beach households received food stamps within the past year. |
Lowellville |
1.4% |
7 of 487 Lowellville households received food stamps within the past year. |
New Middletown |
3.4% |
22 of 654 New Middletown households received food stamps within the past year. |
Poland |
2.2% |
24 of 1,094 Poland households received food stamps within the past year. |
Sebring |
0.4% |
8 of 1,913 Sebring households received food stamps within the past year. |
Struthers |
2.2% |
90 of 4,171 Struthers households received food stamps within the past year. |