New Mexico Food Stamps
How does New Mexico rank for percentage of homes receiving food stamps?
New Mexico ranks 6th out of 50 states for lowest percentage of households receiving food stamps at 1.3%. The study is based on a total of 770,435 New Mexican households who reported whether or not food stamps were received.
How many New Mexico households received food stamps in the past year?
9,632 households in New Mexico received food stamps within the last year.
New Mexico Food Stamps Received Map
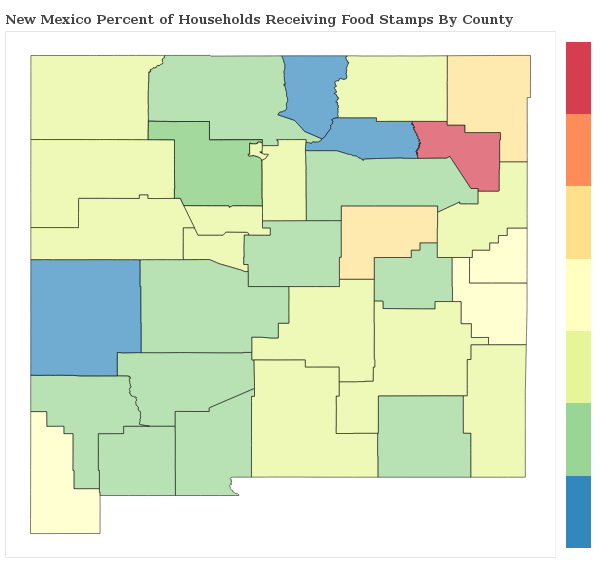
New Mexico Food Stamps Received Map
Food Stamps Received By County
The percentage of households receiving food stamps in New Mexico varies by county.
Applying For New Mexico Food Stamp Programs
How do I apply for food stamps in New Mexico?
There are 4 government food-related benefits that you may apply for as a resident of New Mexico.
Want to explore more government assistance programs? Browse all government benefits available to New Mexico residents.
New Mexico Percentage of Households Receiving Food Stamps by City Statistics
How does the percentage of homes receiving food stamps compare across the largest cities in New Mexico?
| City | Food Stamps | Details |
|---|---|---|
Alamogordo |
0.9% |
Alamogordo ranks 66th of 141 among cities in New Mexico based on a sample of 12,656 New Mexican households in Alamogordo. |
Albuquerque |
1.4% |
Albuquerque ranks 86th of 141 among cities in New Mexico based on a sample of 221,119 New Mexican households in Albuquerque. |
Clovis |
1.3% |
Clovis ranks 85th of 141 among cities in New Mexico based on a sample of 14,727 New Mexican households in Clovis. |
Farmington |
1.3% |
Farmington ranks 83rd of 141 among cities in New Mexico based on a sample of 15,505 New Mexican households in Farmington. |
Hobbs |
1.5% |
Hobbs ranks 92nd of 141 among cities in New Mexico based on a sample of 11,763 New Mexican households in Hobbs. |
Las Cruces |
1.2% |
Las Cruces ranks 76th of 141 among cities in New Mexico based on a sample of 39,809 New Mexican households in Las Cruces. |
Rio Rancho |
1.0% |
Rio Rancho ranks 69th of 141 among cities in New Mexico based on a sample of 33,372 New Mexican households in Rio Rancho. |
Roswell |
1.5% |
Roswell ranks 93rd of 141 among cities in New Mexico based on a sample of 17,556 New Mexican households in Roswell. |
Santa Fe |
1.2% |
Santa Fe ranks 79th of 141 among cities in New Mexico based on a sample of 35,524 New Mexican households in Santa Fe. |
South Valley |
0.9% |
South Valley ranks 60th of 141 among cities in New Mexico based on a sample of 14,108 New Mexican households in South Valley. |
Research & Reports
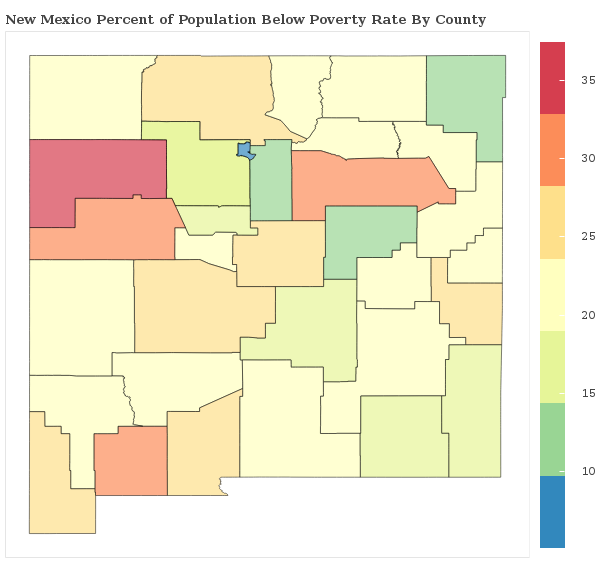
New Mexico Poverty Statistics
Which areas have the highest rate of poverty in New Mexico? We breakdown the poverty rate by city and county across New Mexico and rank communities with the highest and lowest concentrations of residents living below the poverty line.
New Mexico Poverty Statistics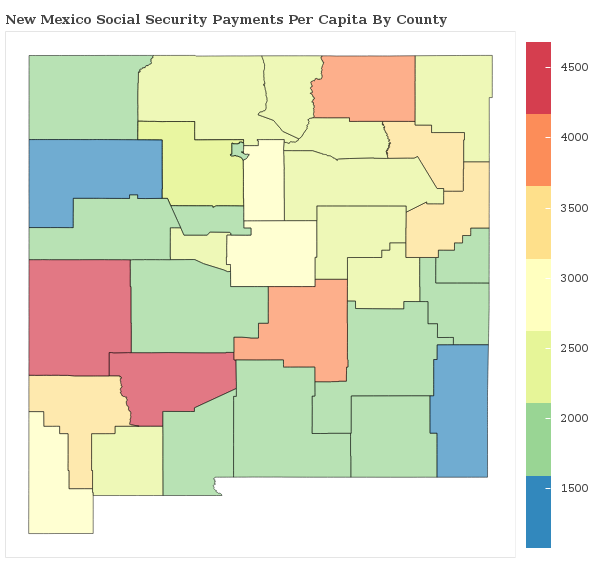
Social Security Payments in New Mexico
How are the Social Security Payments distributed throughout New Mexico? We breakdown social security benefits by city and county statewide and rank communities with the most and least social security income per capita.
New Mexico Social Security
Food Stamps in America
Which areas receive the most food stamp public assistance in your state? We breakdown over 3,000 counties nationwide and rank communities with the most and least food and nutrional supplements given to residents.
See Food Stamp Statistics2018 New Mexico Poverty Line
| Household Size | Poverty Level |
|---|---|
| 1 | $12,140 |
| 2 | $16,460 |
| 3 | $20,780 |
| 4 | $25,100 |
| 5 | $29,420 |
| 6 | $33,740 |
| Per Additional | +$4,320 |
The poverty line for New Mexico in 2018 is based on the federal guidelines, which begins at $12,140 for a single person, adding $4,320 for each additional person.
Poverty In America
