North Carolina Food Stamps
How does North Carolina rank for percentage of homes receiving food stamps?
North Carolina ranks 30th out of 50 states for lowest percentage of households receiving food stamps at 1.6%. The study is based on a total of 3,874,346 North Carolinian households who reported whether or not food stamps were received.
How many North Carolina households received food stamps in the past year?
60,930 households in North Carolina received food stamps within the last year.
North Carolina Food Stamps Received Map
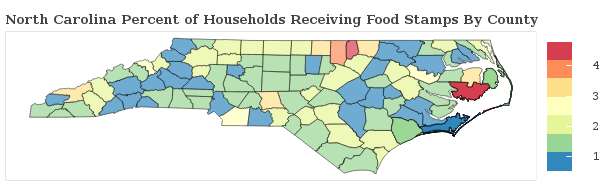
North Carolina Food Stamps Received Map
Food Stamps Received By County
The percentage of households receiving food stamps in North Carolina varies by county.
Applying For North Carolina Food Stamp Programs
How do I apply for food stamps in North Carolina?
There are 5 government food-related benefits that you may apply for as a resident of North Carolina.
Want to explore more government assistance programs? Browse all government benefits available to North Carolina residents.
North Carolina Percentage of Households Receiving Food Stamps by City Statistics
How does the percentage of homes receiving food stamps compare across the largest cities in North Carolina?
| City | Food Stamps | Details |
|---|---|---|
Cary |
3.3% |
Cary ranks 400th of 442 among cities in North Carolina based on a sample of 60,263 North Carolinian households in Cary. |
Charlotte |
1.1% |
Charlotte ranks 201st of 442 among cities in North Carolina based on a sample of 316,481 North Carolinian households in Charlotte. |
Durham |
1.7% |
Durham ranks 289th of 442 among cities in North Carolina based on a sample of 104,966 North Carolinian households in Durham. |
Fayetteville |
1.9% |
Fayetteville ranks 311th of 442 among cities in North Carolina based on a sample of 80,451 North Carolinian households in Fayetteville. |
Greensboro |
1.5% |
Greensboro ranks 263rd of 442 among cities in North Carolina based on a sample of 114,552 North Carolinian households in Greensboro. |
Greenville |
2.5% |
Greenville ranks 359th of 442 among cities in North Carolina based on a sample of 36,585 North Carolinian households in Greenville. |
High Point |
1.5% |
High Point ranks 261st of 442 among cities in North Carolina based on a sample of 40,945 North Carolinian households in High Point. |
Raleigh |
1.8% |
Raleigh ranks 305th of 442 among cities in North Carolina based on a sample of 176,870 North Carolinian households in Raleigh. |
Wilmington |
1.7% |
Wilmington ranks 291st of 442 among cities in North Carolina based on a sample of 50,389 North Carolinian households in Wilmington. |
Winston-Salem |
2.1% |
Winston-Salem ranks 326th of 442 among cities in North Carolina based on a sample of 94,105 North Carolinian households in Winston-Salem. |
Research & Reports
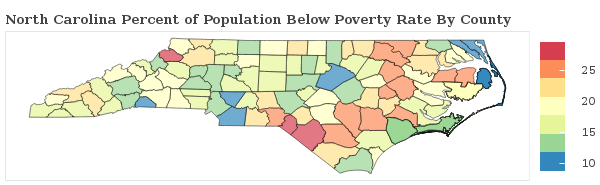
North Carolina Poverty Statistics
Which areas have the highest rate of poverty in North Carolina? We breakdown the poverty rate by city and county across North Carolina and rank communities with the highest and lowest concentrations of residents living below the poverty line.
North Carolina Poverty Statistics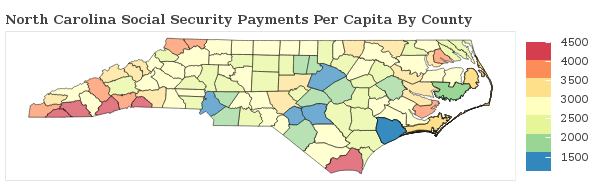
North Carolina Social Security
North Carolina Social Security Statistics
North Carolina Social SecuritySocial Security Payments in North Carolina
How are the Social Security Payments distributed throughout North Carolina? We breakdown social security benefits by city and county statewide and rank communities with the most and least social security income per capita.
North Carolina Social Security
Food Stamps in America
Which areas receive the most food stamp public assistance in your state? We breakdown over 3,000 counties nationwide and rank communities with the most and least food and nutrional supplements given to residents.
See Food Stamp Statistics2018 North Carolina Poverty Line
| Household Size | Poverty Level |
|---|---|
| 1 | $12,140 |
| 2 | $16,460 |
| 3 | $20,780 |
| 4 | $25,100 |
| 5 | $29,420 |
| 6 | $33,740 |
| Per Additional | +$4,320 |
The poverty line for North Carolina in 2018 is based on the federal guidelines, which begins at $12,140 for a single person, adding $4,320 for each additional person.
Poverty In America
