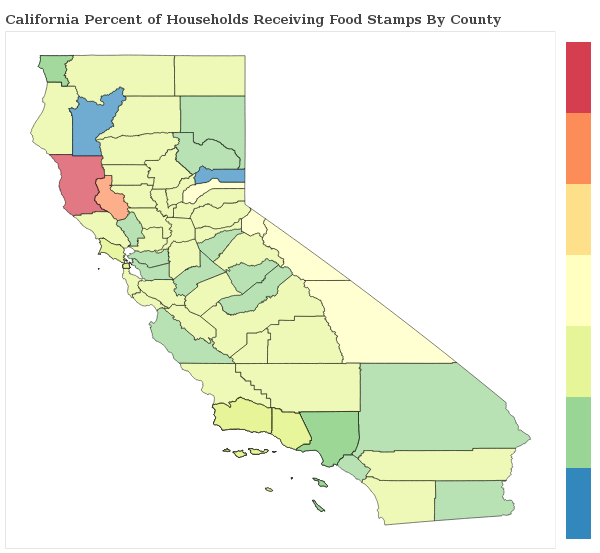
1.0% of Households Receive Food Stamps in Modesto, California
Food Stamps in Modesto, California
What percent of Households Receive Food Stamps in Modesto?
The percentage of households receiving food stamps in the last year in Modesto is 1.0%.
How Many Households in Modesto Receive Food Stamps?
There are 733 households out of 71371 in Modesto receiving food stamps.
Where does Modesto Rank in Comparison to Other California Cities for HouseHolds Receiving Food Stamps?
Modesto ranks 336th out of 1018 cities and towns in California for the least number of households receiving food stamps. A smaller numeric rank indicates a lower percentage of homes receive food stamps.
How do other cities in Stanislaus County compare to Modesto when it comes to the percentage of homes receiving Food Stamps?
Cities must have a minimum of 1,000 residents to qualify
| City | Food Stamps | Details |
|---|---|---|
Ceres |
1.3% |
172 of 13,052 Ceres households received food stamps within the past year. |
Del Rio |
0.0% |
0 of 419 Del Rio households received food stamps within the past year. |
Denair |
1.1% |
17 of 1,502 Denair households received food stamps within the past year. |
East Oakdale |
2.3% |
27 of 1,179 East Oakdale households received food stamps within the past year. |
Grayson |
0.0% |
0 of 237 Grayson households received food stamps within the past year. |
Airport |
1.4% |
7 of 504 Airport households received food stamps within the past year. |
Bret Harte |
0.4% |
6 of 1,336 Bret Harte households received food stamps within the past year. |
Bystrom |
0.0% |
0 of 1,120 Bystrom households received food stamps within the past year. |
Empire |
0.4% |
6 of 1,343 Empire households received food stamps within the past year. |
Hughson |
0.0% |
0 of 2,262 Hughson households received food stamps within the past year. |
Keyes |
0.0% |
0 of 1,714 Keyes households received food stamps within the past year. |
Modesto |
1.0% |
733 of 71,371 Modesto households received food stamps within the past year. |
Newman |
0.4% |
12 of 3,114 Newman households received food stamps within the past year. |
Oakdale |
1.1% |
88 of 7,762 Oakdale households received food stamps within the past year. |
Parklawn |
0.0% |
0 of 330 Parklawn households received food stamps within the past year. |
Patterson |
0.6% |
34 of 5,783 Patterson households received food stamps within the past year. |
Riverbank |
0.6% |
46 of 7,091 Riverbank households received food stamps within the past year. |
Riverdale Park |
0.0% |
0 of 301 Riverdale Park households received food stamps within the past year. |
Rouse |
1.8% |
9 of 491 Rouse households received food stamps within the past year. |
Salida |
1.9% |
80 of 4,257 Salida households received food stamps within the past year. |
Turlock |
1.4% |
340 of 24,666 Turlock households received food stamps within the past year. |
Waterford |
0.9% |
22 of 2,436 Waterford households received food stamps within the past year. |
West Modesto |
0.6% |
9 of 1,544 West Modesto households received food stamps within the past year. |
