1.3% of Households Receive Food Stamps in Pasadena, California
Food Stamps in Pasadena, California
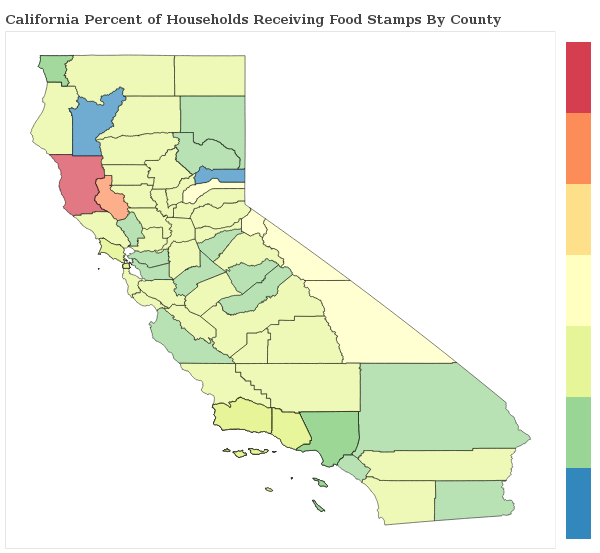
What percent of Households Receive Food Stamps in Pasadena?
The percentage of households receiving food stamps in the last year in Pasadena is 1.3%.
How Many Households in Pasadena Receive Food Stamps?
There are 728 households out of 54734 in Pasadena receiving food stamps.
Where does Pasadena Rank in Comparison to Other California Cities for HouseHolds Receiving Food Stamps?
Pasadena ranks 494th out of 1018 cities and towns in California for the least number of households receiving food stamps. A smaller numeric rank indicates a lower percentage of homes receive food stamps.
How do other cities in Los Angeles County compare to Pasadena when it comes to the percentage of homes receiving Food Stamps?
Cities must have a minimum of 1,000 residents to qualify
| City | Food Stamps | Details |
|---|---|---|
Carson |
1.7% |
439 of 25,381 Carson households received food stamps within the past year. |
Castaic |
1.0% |
56 of 5,766 Castaic households received food stamps within the past year. |
Cerritos |
1.3% |
200 of 15,541 Cerritos households received food stamps within the past year. |
Charter Oak |
1.2% |
33 of 2,831 Charter Oak households received food stamps within the past year. |
Citrus |
0.7% |
18 of 2,660 Citrus households received food stamps within the past year. |
Claremont |
1.5% |
171 of 11,620 Claremont households received food stamps within the past year. |
Commerce |
0.6% |
23 of 3,589 Commerce households received food stamps within the past year. |
Compton |
1.8% |
424 of 23,657 Compton households received food stamps within the past year. |
Covina |
1.6% |
241 of 15,193 Covina households received food stamps within the past year. |
Cudahy |
0.8% |
47 of 5,543 Cudahy households received food stamps within the past year. |
Culver City |
1.6% |
263 of 16,543 Culver City households received food stamps within the past year. |
Del Aire |
0.9% |
31 of 3,303 Del Aire households received food stamps within the past year. |
Desert View Highlands |
0.0% |
0 of 816 Desert View Highlands households received food stamps within the past year. |
Diamond Bar |
1.1% |
194 of 17,810 Diamond Bar households received food stamps within the past year. |
Downey |
1.0% |
338 of 32,696 Downey households received food stamps within the past year. |
Duarte |
1.0% |
68 of 6,980 Duarte households received food stamps within the past year. |
East Los Angeles |
1.2% |
385 of 31,938 East Los Angeles households received food stamps within the past year. |
East Pasadena |
0.8% |
16 of 1,940 East Pasadena households received food stamps within the past year. |
East Rancho Dominguez |
0.6% |
19 of 3,429 East Rancho Dominguez households received food stamps within the past year. |
East San Gabriel |
0.9% |
45 of 5,141 East San Gabriel households received food stamps within the past year. |
Elizabeth Lake |
0.0% |
0 of 720 Elizabeth Lake households received food stamps within the past year. |
El Monte |
1.6% |
481 of 29,550 El Monte households received food stamps within the past year. |
Gardena |
1.7% |
341 of 20,649 Gardena households received food stamps within the past year. |
Glendale |
1.4% |
1006 of 72,738 Glendale households received food stamps within the past year. |
Glendora |
1.0% |
165 of 17,080 Glendora households received food stamps within the past year. |
Artesia |
0.9% |
40 of 4,517 Artesia households received food stamps within the past year. |
Avalon |
0.0% |
0 of 1,358 Avalon households received food stamps within the past year. |
Avocado Heights |
0.6% |
22 of 3,865 Avocado Heights households received food stamps within the past year. |
Azusa |
1.5% |
186 of 12,495 Azusa households received food stamps within the past year. |
Baldwin Park |
1.0% |
180 of 17,678 Baldwin Park households received food stamps within the past year. |
Bell |
1.3% |
120 of 8,921 Bell households received food stamps within the past year. |
Bellflower |
1.0% |
243 of 23,359 Bellflower households received food stamps within the past year. |
Bell Gardens |
0.5% |
50 of 9,659 Bell Gardens households received food stamps within the past year. |
Beverly Hills |
1.3% |
199 of 14,902 Beverly Hills households received food stamps within the past year. |
Acton |
2.1% |
55 of 2,626 Acton households received food stamps within the past year. |
Agoura Hills |
0.0% |
0 of 7,338 Agoura Hills households received food stamps within the past year. |
Agua Dulce |
6.3% |
74 of 1,175 Agua Dulce households received food stamps within the past year. |
Alhambra |
0.9% |
273 of 29,179 Alhambra households received food stamps within the past year. |
Alondra Park |
1.4% |
33 of 2,422 Alondra Park households received food stamps within the past year. |
Altadena |
1.1% |
163 of 15,475 Altadena households received food stamps within the past year. |
Arcadia |
1.0% |
186 of 19,442 Arcadia households received food stamps within the past year. |
Burbank |
1.9% |
774 of 41,664 Burbank households received food stamps within the past year. |
Calabasas |
1.6% |
139 of 8,904 Calabasas households received food stamps within the past year. |
El Segundo |
1.2% |
82 of 6,638 El Segundo households received food stamps within the past year. |
Florence-Graham |
1.8% |
269 of 14,758 Florence-Graham households received food stamps within the past year. |
Green Valley |
0.0% |
0 of 440 Green Valley households received food stamps within the past year. |
Hacienda Heights |
2.0% |
321 of 16,202 Hacienda Heights households received food stamps within the past year. |
Hasley Canyon |
1.8% |
6 of 326 Hasley Canyon households received food stamps within the past year. |
Hawaiian Gardens |
0.8% |
30 of 3,875 Hawaiian Gardens households received food stamps within the past year. |
Hawthorne |
1.5% |
455 of 29,488 Hawthorne households received food stamps within the past year. |
Hermosa Beach |
1.5% |
135 of 9,158 Hermosa Beach households received food stamps within the past year. |
Hidden Hills |
1.5% |
8 of 551 Hidden Hills households received food stamps within the past year. |
Huntington Park |
1.6% |
232 of 14,462 Huntington Park households received food stamps within the past year. |
Inglewood |
2.1% |
771 of 36,481 Inglewood households received food stamps within the past year. |
Irwindale |
0.8% |
3 of 374 Irwindale households received food stamps within the past year. |
La Cañada Flintridge |
1.1% |
71 of 6,582 La Cañada Flintridge households received food stamps within the past year. |
La Crescenta-Montrose |
1.6% |
113 of 6,850 La Crescenta-Montrose households received food stamps within the past year. |
Ladera Heights |
1.1% |
33 of 2,963 Ladera Heights households received food stamps within the past year. |
La Habra Heights |
0.0% |
0 of 1,836 La Habra Heights households received food stamps within the past year. |
Lake Los Angeles |
1.5% |
50 of 3,374 Lake Los Angeles households received food stamps within the past year. |
Lakewood |
1.0% |
260 of 25,957 Lakewood households received food stamps within the past year. |
La Mirada |
1.5% |
213 of 14,371 La Mirada households received food stamps within the past year. |
Lancaster |
1.5% |
706 of 48,124 Lancaster households received food stamps within the past year. |
La Puente |
0.9% |
78 of 8,998 La Puente households received food stamps within the past year. |
La Verne |
0.9% |
99 of 11,236 La Verne households received food stamps within the past year. |
Lawndale |
1.8% |
181 of 9,875 Lawndale households received food stamps within the past year. |
Lennox |
1.3% |
70 of 5,311 Lennox households received food stamps within the past year. |
Leona Valley |
1.6% |
10 of 622 Leona Valley households received food stamps within the past year. |
Littlerock |
5.0% |
23 of 460 Littlerock households received food stamps within the past year. |
Lomita |
0.9% |
69 of 8,070 Lomita households received food stamps within the past year. |
Long Beach |
1.3% |
2163 of 165,001 Long Beach households received food stamps within the past year. |
Los Angeles |
1.4% |
19222 of 1,364,227 Los Angeles households received food stamps within the past year. |
Lynwood |
1.8% |
283 of 15,333 Lynwood households received food stamps within the past year. |
Malibu |
1.8% |
97 of 5,499 Malibu households received food stamps within the past year. |
Manhattan Beach |
1.6% |
211 of 13,529 Manhattan Beach households received food stamps within the past year. |
Marina del Rey |
0.2% |
13 of 5,523 Marina del Rey households received food stamps within the past year. |
Mayflower Village |
1.0% |
18 of 1,824 Mayflower Village households received food stamps within the past year. |
Maywood |
1.4% |
96 of 6,629 Maywood households received food stamps within the past year. |
Monrovia |
1.0% |
134 of 13,000 Monrovia households received food stamps within the past year. |
Montebello |
1.3% |
258 of 19,844 Montebello households received food stamps within the past year. |
Monterey Park |
1.6% |
309 of 19,728 Monterey Park households received food stamps within the past year. |
North El Monte |
0.6% |
8 of 1,262 North El Monte households received food stamps within the past year. |
Norwalk |
1.7% |
452 of 27,238 Norwalk households received food stamps within the past year. |
Palmdale |
1.5% |
683 of 44,075 Palmdale households received food stamps within the past year. |
Palos Verdes Estates |
2.0% |
95 of 4,757 Palos Verdes Estates households received food stamps within the past year. |
Paramount |
1.4% |
205 of 14,339 Paramount households received food stamps within the past year. |
Pasadena |
1.3% |
728 of 54,734 Pasadena households received food stamps within the past year. |
Pico Rivera |
1.3% |
223 of 17,027 Pico Rivera households received food stamps within the past year. |
Pomona |
1.5% |
579 of 38,869 Pomona households received food stamps within the past year. |
Quartz Hill |
1.1% |
38 of 3,542 Quartz Hill households received food stamps within the past year. |
Rancho Palos Verdes |
0.7% |
110 of 15,780 Rancho Palos Verdes households received food stamps within the past year. |
Redondo Beach |
0.9% |
255 of 27,820 Redondo Beach households received food stamps within the past year. |
Rolling Hills |
2.4% |
15 of 615 Rolling Hills households received food stamps within the past year. |
Rolling Hills Estates |
1.4% |
42 of 3,026 Rolling Hills Estates households received food stamps within the past year. |
Rose Hills |
0.0% |
0 of 1,021 Rose Hills households received food stamps within the past year. |
Rosemead |
2.2% |
323 of 14,671 Rosemead households received food stamps within the past year. |
Rowland Heights |
1.1% |
158 of 14,751 Rowland Heights households received food stamps within the past year. |
San Dimas |
1.4% |
161 of 11,749 San Dimas households received food stamps within the past year. |
San Fernando |
1.9% |
120 of 6,249 San Fernando households received food stamps within the past year. |
San Gabriel |
1.3% |
154 of 12,239 San Gabriel households received food stamps within the past year. |
San Marino |
1.9% |
84 of 4,515 San Marino households received food stamps within the past year. |
San Pasqual |
1.0% |
9 of 894 San Pasqual households received food stamps within the past year. |
Santa Clarita |
1.4% |
974 of 67,914 Santa Clarita households received food stamps within the past year. |
Santa Fe Springs |
0.6% |
28 of 5,078 Santa Fe Springs households received food stamps within the past year. |
Santa Monica |
1.2% |
547 of 46,358 Santa Monica households received food stamps within the past year. |
Sierra Madre |
1.8% |
81 of 4,441 Sierra Madre households received food stamps within the past year. |
Signal Hill |
1.8% |
78 of 4,368 Signal Hill households received food stamps within the past year. |
South El Monte |
2.0% |
106 of 5,304 South El Monte households received food stamps within the past year. |
South Gate |
1.3% |
317 of 23,557 South Gate households received food stamps within the past year. |
South Monrovia Island |
2.3% |
37 of 1,612 South Monrovia Island households received food stamps within the past year. |
South Pasadena |
1.5% |
156 of 10,248 South Pasadena households received food stamps within the past year. |
South San Gabriel |
1.6% |
37 of 2,334 South San Gabriel households received food stamps within the past year. |
South San Jose Hills |
0.9% |
36 of 4,136 South San Jose Hills households received food stamps within the past year. |
South Whittier |
1.0% |
150 of 15,484 South Whittier households received food stamps within the past year. |
Stevenson Ranch |
1.1% |
73 of 6,348 Stevenson Ranch households received food stamps within the past year. |
Sun Village |
1.2% |
37 of 3,147 Sun Village households received food stamps within the past year. |
Temple City |
1.0% |
113 of 11,094 Temple City households received food stamps within the past year. |
Topanga |
2.6% |
85 of 3,242 Topanga households received food stamps within the past year. |
Torrance |
1.5% |
848 of 54,904 Torrance households received food stamps within the past year. |
Valinda |
2.3% |
119 of 5,236 Valinda households received food stamps within the past year. |
Val Verde |
0.0% |
0 of 748 Val Verde households received food stamps within the past year. |
View Park-Windsor Hills |
2.2% |
102 of 4,662 View Park-Windsor Hills households received food stamps within the past year. |
Walnut |
1.2% |
112 of 9,081 Walnut households received food stamps within the past year. |
Walnut Park |
0.6% |
22 of 3,744 Walnut Park households received food stamps within the past year. |
West Athens |
4.8% |
133 of 2,795 West Athens households received food stamps within the past year. |
West Carson |
0.6% |
42 of 7,458 West Carson households received food stamps within the past year. |
West Covina |
1.3% |
405 of 30,752 West Covina households received food stamps within the past year. |
West Hollywood |
0.9% |
194 of 22,602 West Hollywood households received food stamps within the past year. |
Westlake Village |
0.5% |
18 of 3,363 Westlake Village households received food stamps within the past year. |
Westmont |
2.5% |
260 of 10,398 Westmont households received food stamps within the past year. |
West Puente Valley |
1.8% |
92 of 5,015 West Puente Valley households received food stamps within the past year. |
West Rancho Dominguez |
1.1% |
72 of 6,295 West Rancho Dominguez households received food stamps within the past year. |
West Whittier-Los Nietos |
1.1% |
75 of 7,115 West Whittier-Los Nietos households received food stamps within the past year. |
Whittier |
1.1% |
306 of 27,803 Whittier households received food stamps within the past year. |
Willowbrook |
1.8% |
89 of 5,010 Willowbrook households received food stamps within the past year. |