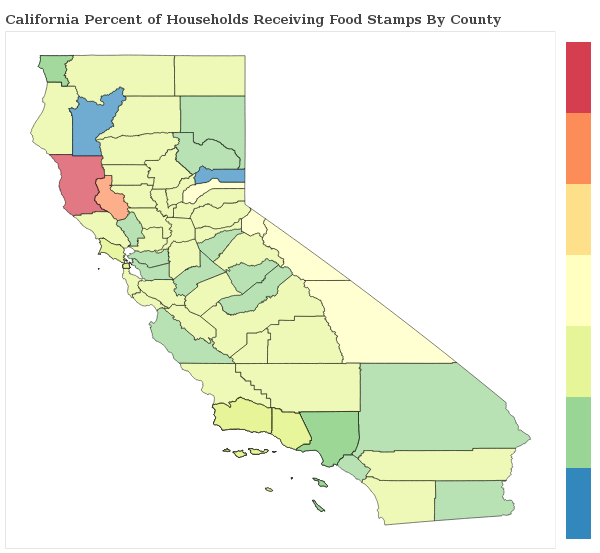
1.6% of Households Receive Food Stamps in Sacramento, California
Food Stamps in Sacramento, California
What percent of Households Receive Food Stamps in Sacramento?
The percentage of households receiving food stamps in the last year in Sacramento is 1.6%.
How Many Households in Sacramento Receive Food Stamps?
There are 2908 households out of 181690 in Sacramento receiving food stamps.
Where does Sacramento Rank in Comparison to Other California Cities for HouseHolds Receiving Food Stamps?
Sacramento ranks 644th out of 1018 cities and towns in California for the least number of households receiving food stamps. A smaller numeric rank indicates a lower percentage of homes receive food stamps.
How do other cities in Sacramento County compare to Sacramento when it comes to the percentage of homes receiving Food Stamps?
Cities must have a minimum of 1,000 residents to qualify
| City | Food Stamps | Details |
|---|---|---|
Carmichael |
1.2% |
319 of 26,241 Carmichael households received food stamps within the past year. |
Citrus Heights |
1.7% |
564 of 33,865 Citrus Heights households received food stamps within the past year. |
Clay |
3.1% |
13 of 413 Clay households received food stamps within the past year. |
Elk Grove |
2.5% |
1274 of 51,351 Elk Grove households received food stamps within the past year. |
Fruitridge Pocket |
1.8% |
31 of 1,719 Fruitridge Pocket households received food stamps within the past year. |
Galt |
3.3% |
256 of 7,846 Galt households received food stamps within the past year. |
Gold River |
0.8% |
27 of 3,279 Gold River households received food stamps within the past year. |
Antelope |
0.9% |
129 of 14,463 Antelope households received food stamps within the past year. |
Arden-Arcade |
1.5% |
597 of 41,111 Arden-Arcade households received food stamps within the past year. |
Elverta |
4.0% |
73 of 1,820 Elverta households received food stamps within the past year. |
Fair Oaks |
1.3% |
168 of 12,516 Fair Oaks households received food stamps within the past year. |
Florin |
3.2% |
473 of 14,895 Florin households received food stamps within the past year. |
Folsom |
0.9% |
241 of 26,843 Folsom households received food stamps within the past year. |
Foothill Farms |
1.4% |
168 of 11,655 Foothill Farms households received food stamps within the past year. |
Herald |
1.4% |
5 of 356 Herald households received food stamps within the past year. |
La Riviera |
0.7% |
31 of 4,358 La Riviera households received food stamps within the past year. |
Lemon Hill |
1.3% |
56 of 4,249 Lemon Hill households received food stamps within the past year. |
McClellan Park |
0.0% |
0 of 328 McClellan Park households received food stamps within the past year. |
Mather |
0.9% |
12 of 1,391 Mather households received food stamps within the past year. |
North Highlands |
1.6% |
250 of 15,284 North Highlands households received food stamps within the past year. |
Orangevale |
1.3% |
174 of 12,945 Orangevale households received food stamps within the past year. |
Parkway |
2.0% |
96 of 4,740 Parkway households received food stamps within the past year. |
Rancho Cordova |
1.8% |
438 of 24,546 Rancho Cordova households received food stamps within the past year. |
Rancho Murieta |
1.4% |
33 of 2,375 Rancho Murieta households received food stamps within the past year. |
Rio Linda |
1.1% |
53 of 4,805 Rio Linda households received food stamps within the past year. |
Rosemont |
1.7% |
140 of 8,419 Rosemont households received food stamps within the past year. |
Sacramento |
1.6% |
2908 of 181,690 Sacramento households received food stamps within the past year. |
Vineyard |
1.9% |
154 of 8,035 Vineyard households received food stamps within the past year. |
Walnut Grove |
0.0% |
0 of 496 Walnut Grove households received food stamps within the past year. |
Wilton |
1.1% |
22 of 1,945 Wilton households received food stamps within the past year. |
